U.S. May New Home Sales - Strong April, weak May, prices rise, but trend may be slowing
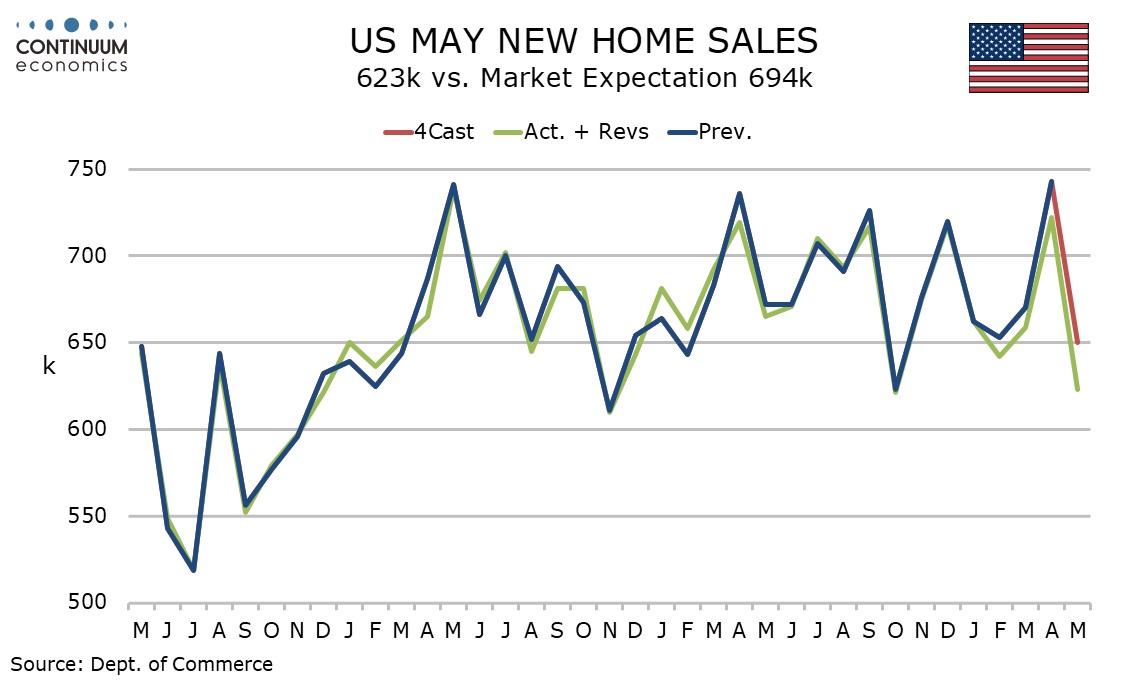
May new home sales have fallen by 13.7% to 623k to more than fully reverse April’s 9.6% rise to 722k (revised from 743k). April’s total (after the revision) is the highest since May 2023 while May’s total is the lowest since October 2024. Trend has no clear direction but on balance housing data is suggesting a loss of momentum.
April’s level was as originally reported the strongest since February 2022 but even after the revision is marginally above the 2024 high of 719k seen in April. The 2024 low of 621k was seen in October and followed a strong 717k seen in September. Again we have a weak number after a strong number. The average of April and May is 672.5k, above the Q1 average of 654k.
While there is no clear trend in new home sales existing home sales are looking softer, despite little change in both April and May data, while the NAHB homebuilders’ index has also softened. April house price data from FHFA and S and P Case-Shiller surveys were also weaker.
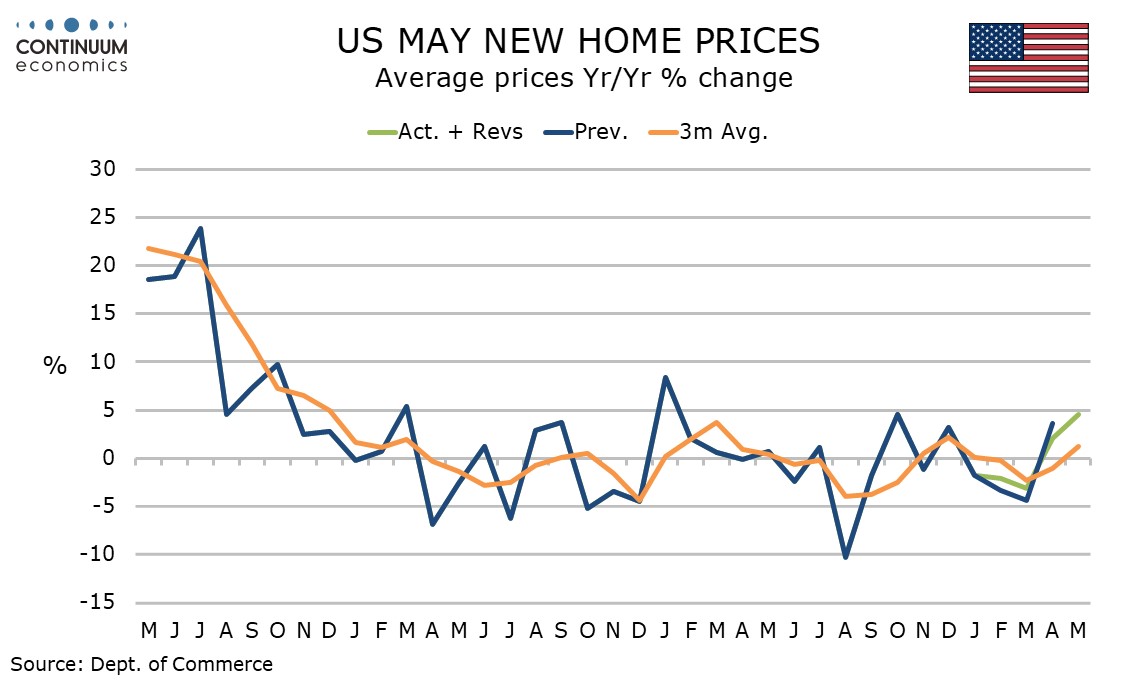
May price data from the new home sales report was however stronger, the median up 3.7% on the month with yr/yr growth of 3.0% the highest since January 2024. The average price also increased, by 2.2% on the month with yr/yr growth of 4.6% the highest since a matching October 2024.
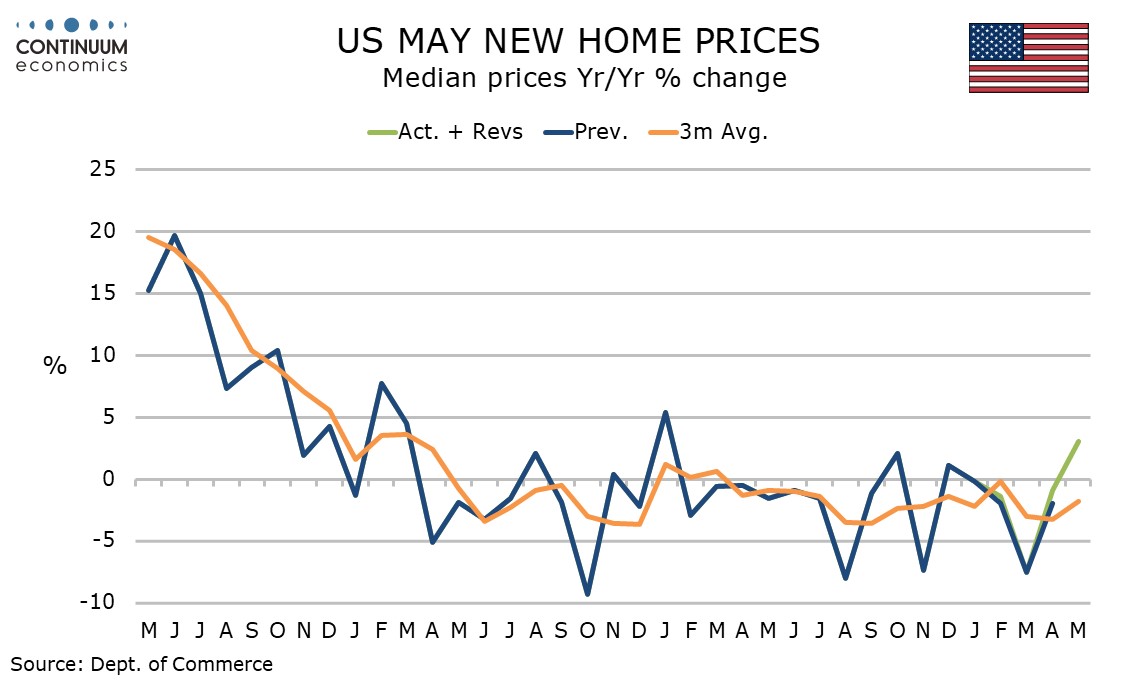
These price series are volatile and given the weakness of sales and other price surveys the May new home sale prices should be treated with caution.