This week's five highlights
Israel Strikes Iran Nuclear Facilities and Key Target
China and July 9 U.S. Reciprocal Tariff Deadline
U.S. May CPI Shows Little tariff pass-through
Soft U.S. May PPI but recent revisions have been large
UK GDP Overstating Activity
Israel has launched multiple wave of air strikes and have killed at least one top level Iranian official, destroying a nuclear enrichment site too. Despite the U.S. officially released a statement of non-involvement, Iran already vowed to retaliate both the U.S. and Israel. There has been reports of Iranian ballistic missiles being launched. Iran confirms that the commander of the Khatam al-Anbiya Central Headquarters, Gholam Ali Rashid, alongside armed forces chief of staff Mohammad Bagheri and Revolutionary Guards chief Hossein Salami were killed by Israel's attacks. Subsequently, Iran also pulled out of their nuclear talk with the U.S.. There is no doubt Iran will retaliate and already seen Israel intercepting drones attack but market participants will be concerned about further retaliation, especially against U.S. personnel.

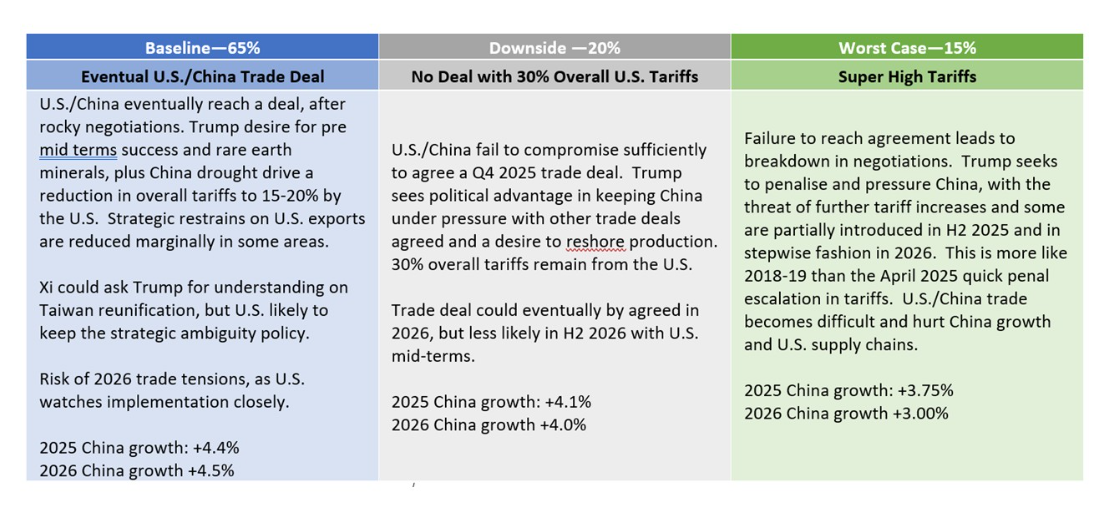
We attach a 65% probability to a U.S./China reaching a new trade deal that reduces the minimum overall tariff to 15-20% imposed by the U.S., most likely agreed in Q4 2025 and to be implemented in 2026. However, a 35% probability exist of no deal and this could eventually mean higher tariffs (Figure). Meanwhile, the Trump administration sending out post July 9 reciprocal tariff rates is more than a negotiating tactic before a further 90-day delay. The delay could be less than 90 days or the EU could be singled out with a 20% reciprocal tariff after July 9 to pressure the EU and other countries.
President Donald Trump is proclaiming a trade deal with China, whereas it a trade truce before difficult negotiations in the next 6 months on a phase 2 trade deal. Meanwhile, Trump on Wednesday threatened higher reciprocal tariffs after July 9 if trade deals are not done.

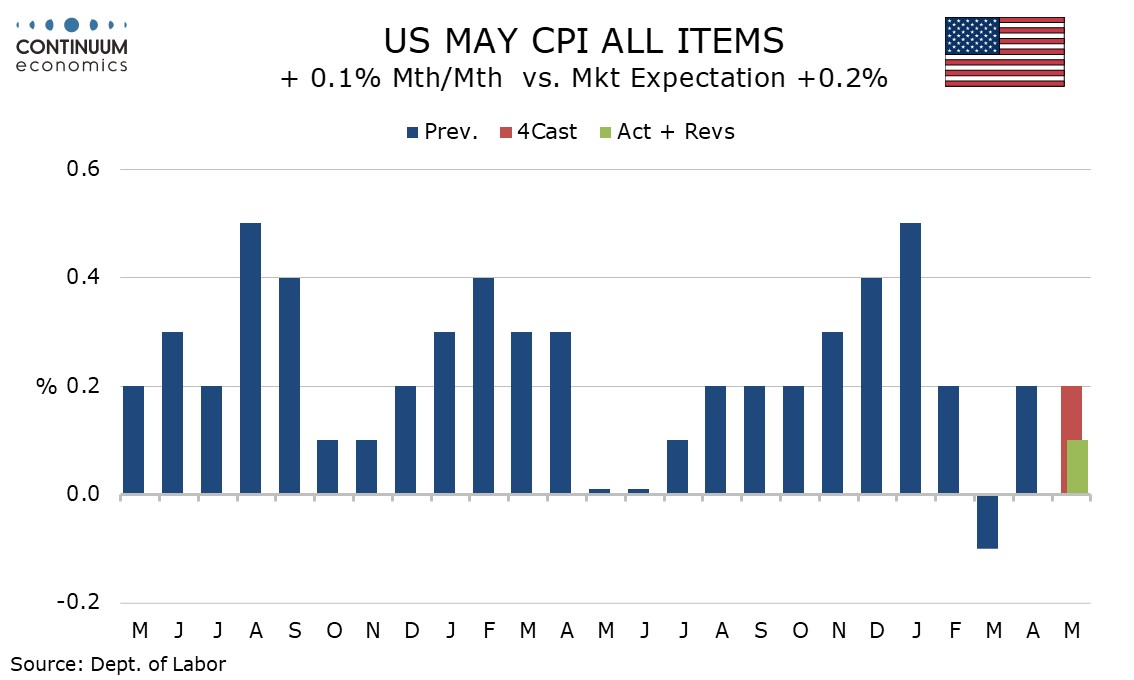
May CPI has surprised significantly to the downside, up only 0.1% both headline and core, with the respective gains before rounding being 0.08% and 0.13%. The data is subdued across the board, with commodities ex food and energy unchanged despite tariffs and services ex energy on the low side of trend at 0.2%.
Food was slightly above trend with a 0.3% increase after a 0.1% decline in April despite eggs continuing to move off recent highs, albeit less steeply than in April. However the gain in food was outweighed by a 1.0% fall in energy, ked by a 2.6% fall in gasoline. The components that restrained core commodities in April did so again in May. Apparel, despite being susceptible to tariffs, fell by 0.4% after a 0.2% fall in April. Used autos saw a third straight fall, by 0.5%, while new vehicles fell by 0.3%, the first fall since February. Transportation services fell by 0.2%, led by continued weakness in air fares at -2.7%. Lodging away from home fell by 0.1% for a second straight month to follow a 3.5% plunge in March. These sectors have taken a hit on reduced tourist arrivals from abroad. The heavily weighted owners’ equivalent rent rose by 0.3% after two straight gains of 0.4%.

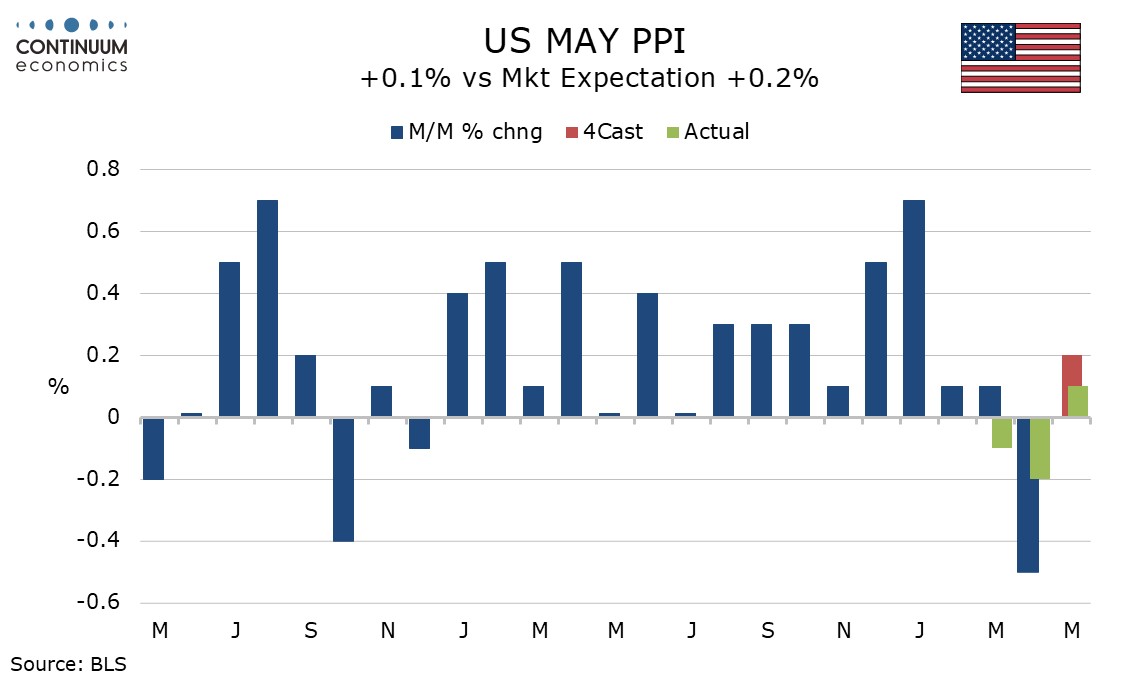
May’s PPI, matching May’s CPI, has come in softer than expected at 0.1% and in both the core rates, ex food and energy and ex food, energy and trade, though the downside surprise is partially offset by upward revisions to April, overall and ex food and energy both to -0.2% from -0.5% and -0.4% respectively, though ex food, energy and trade is unrevised at -0.1%. Initial claims are unchanged at 248k, but trend is showing signs of picking up as we enter June. June’s payroll may be less resilient than May’s.
Recent PPI data has been subject to significant revisions. The upward revision to April’s weakness follows an upward revision to a weak March in April’s report, from -0.4% to a 0.1% increase, though with May’s report March has been revised back down to -0.1%. Concern has been raised over staffing shortages reducing the accuracy of Labor Dep’t measurement, most vocally regarding CPI data, which is not subject to revisions. However large recent revisions to PPI data amplify these concerns. Recent PPI data has been on the firm side in goods ex food and energy, which rose by 0.2% in May after three straight gains of 0.3%. Services data, after a strong start to Q1, has been very soft in Q2 to date, unchanged in May after a 0.3% fall in April. Food rose by 0.1% and energy was unchanged.
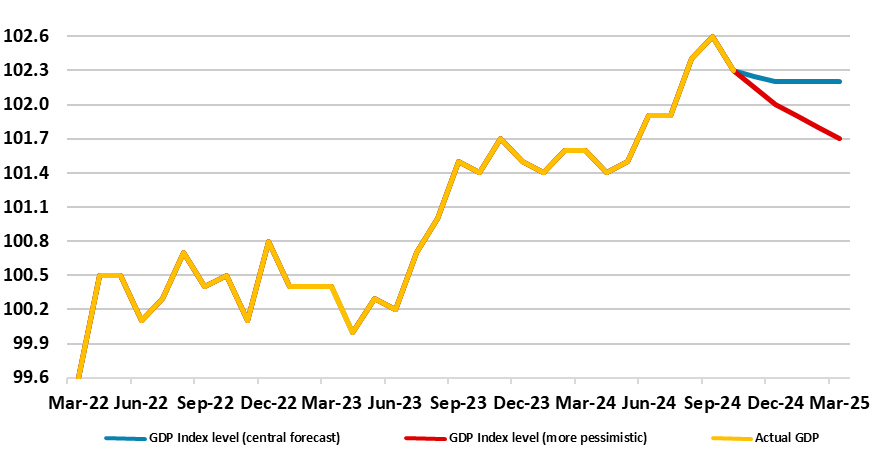
Figure: Actual GDP Outlook - Alternatives

After two successive upside surprises, a correction back in monthly GDP could be expected for the April data, especially as Q1 numbers may have been boosted by added production destined for the U.S in anticipation of tariffs. In addition, real estate activity seems to have dropped after the raising of effective stamp duty. But we already know that retail sales rose clearly in the month probably boosted by record sunshine and temperatures during April, although this probably caused the sharp fall in utility output. As a result, April GDP dropped 0.3% m/m, more than unwinding March’s 0.2% rise, thereby continuing the volatility of recent months. We think that GDP will be flat to down a notch in q/q terms this quarter and may be as weal in Q3, the former undershooting BoE thinking by a notch and even more so next quarter. Such weakness chimes with business surveys, payrolls and tax outcomes. If this pattern persists (let alone if it is even worse (Figure 1), then the BoE relative complacency regarding the economy is likely to shift.