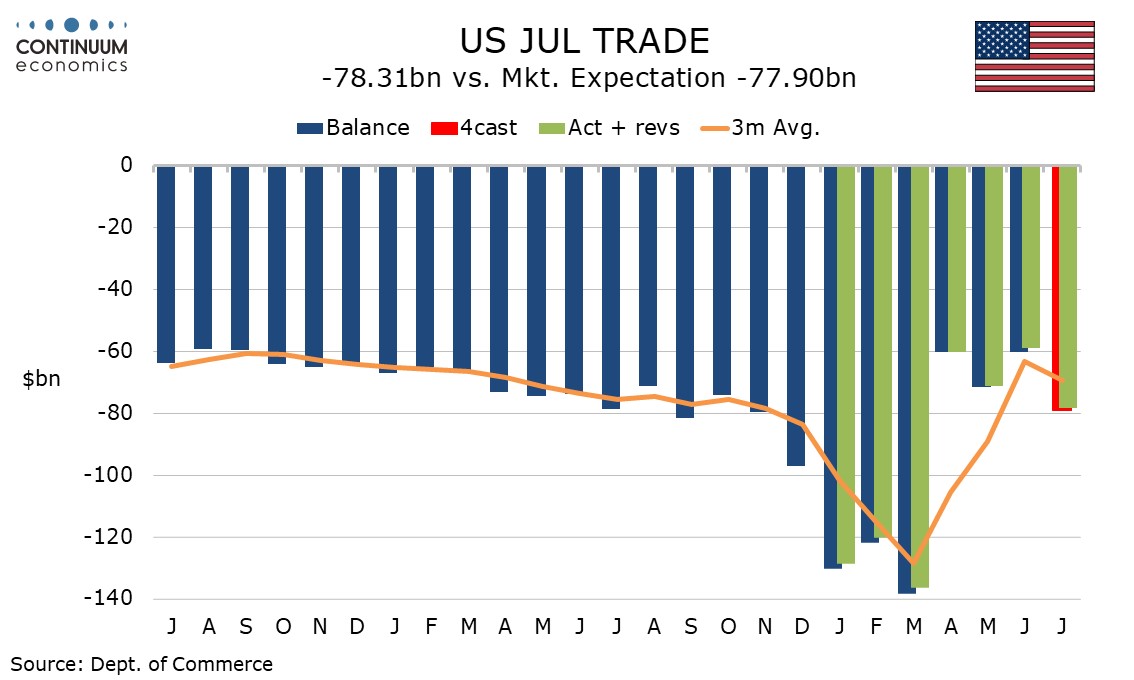
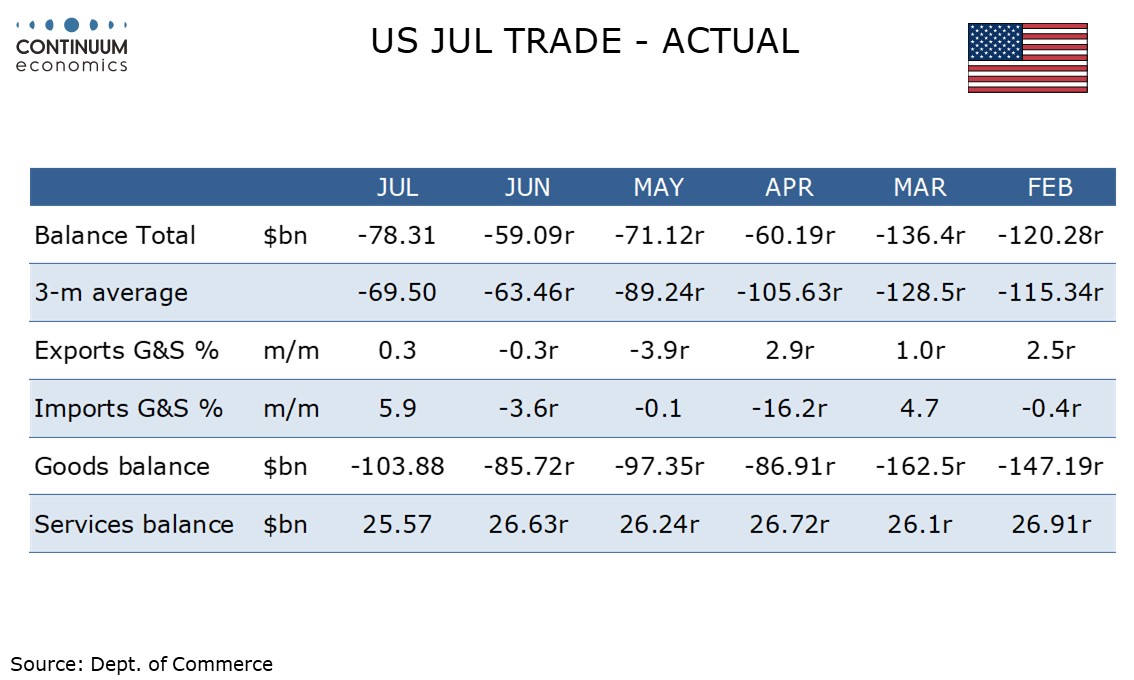
July US trade deficit up as imports bounce, deficits with Canada and China increase
July’s US trade deficit of $78.3bn was not far off expectations, but up sharply from $59.1bn in June. Imports bounced by 5.9% after three straight declines, while exports saw a modest rise of 0.3% after two straight declines.
Goods exports rose by 0.1% compared with a 0.1% decline in advance data while goods imports rose by 6.9% compared with a 7.1% rise in advance data.
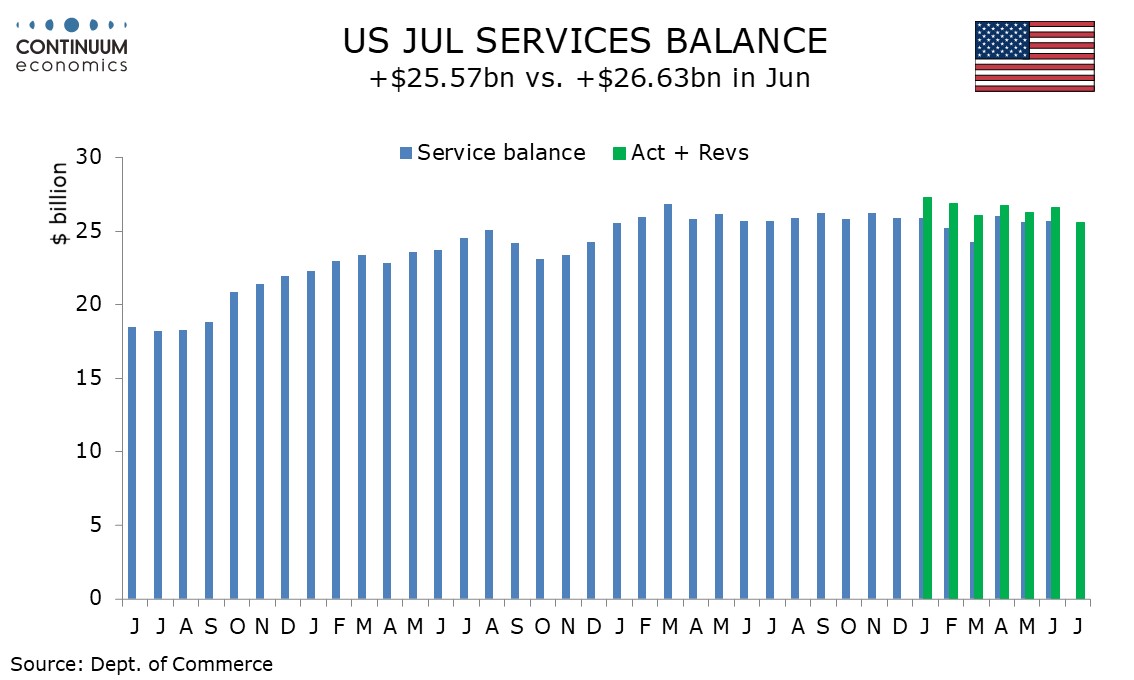
Services showed a weaker surplus with exports up by 0.6% and imports up a strong 2.3% but the decline in July’s surplus was balanced by an upward revision to June and several preceding months.
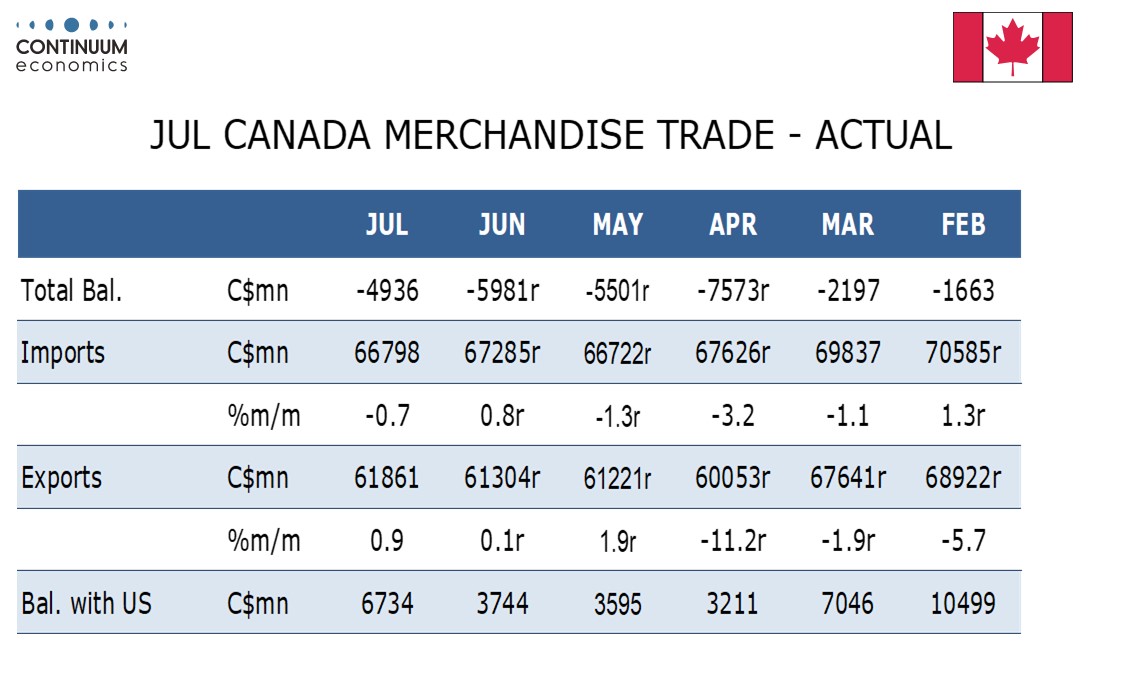
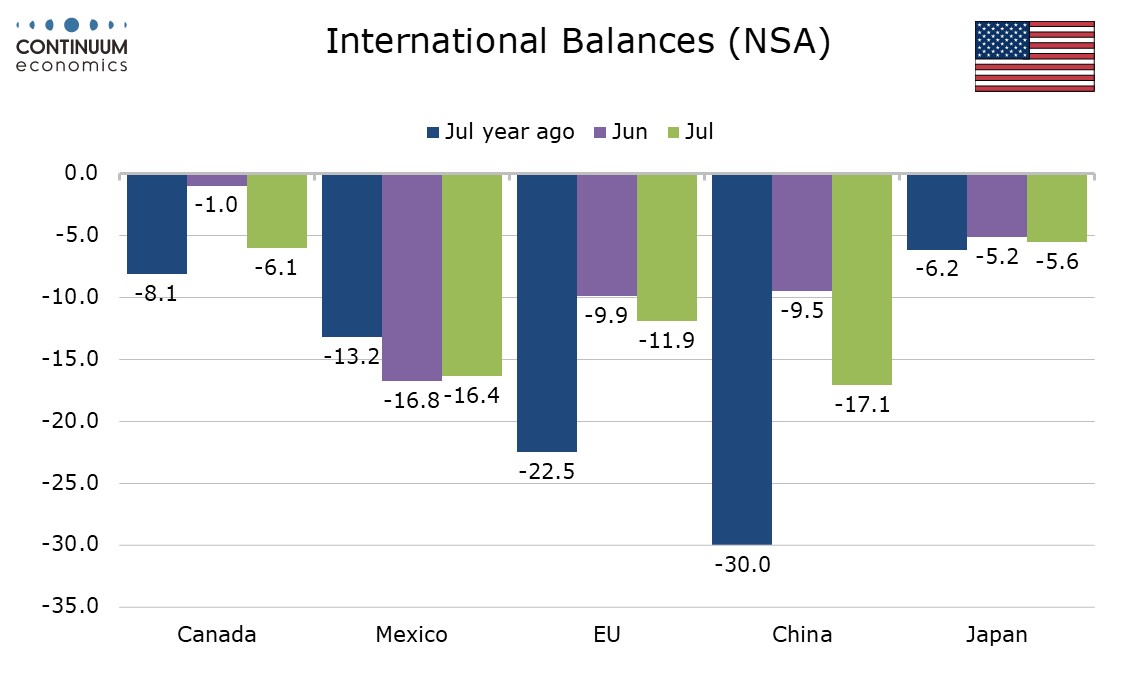
Data by country showed significant increases in the deficits with Canada and China. The deterioration with Canada was backed by Canada’s own data, which showed exports to the US up by 5.0% while imports from the US fell by 2.2%, though Canada’s overall exports rose by only 0.9% and Canada’s overall imports fell by only 0.7%.
Imports from China picked up from a very low level reflecting tariffs on China moving off extreme levels, though imports from China are still down by 35.3% yr/yr, after two straight declines of over 40%. Exports to China fell by 13.7% yr/yr, versus a 17.0% decline in June and a 42.1% decline in May.
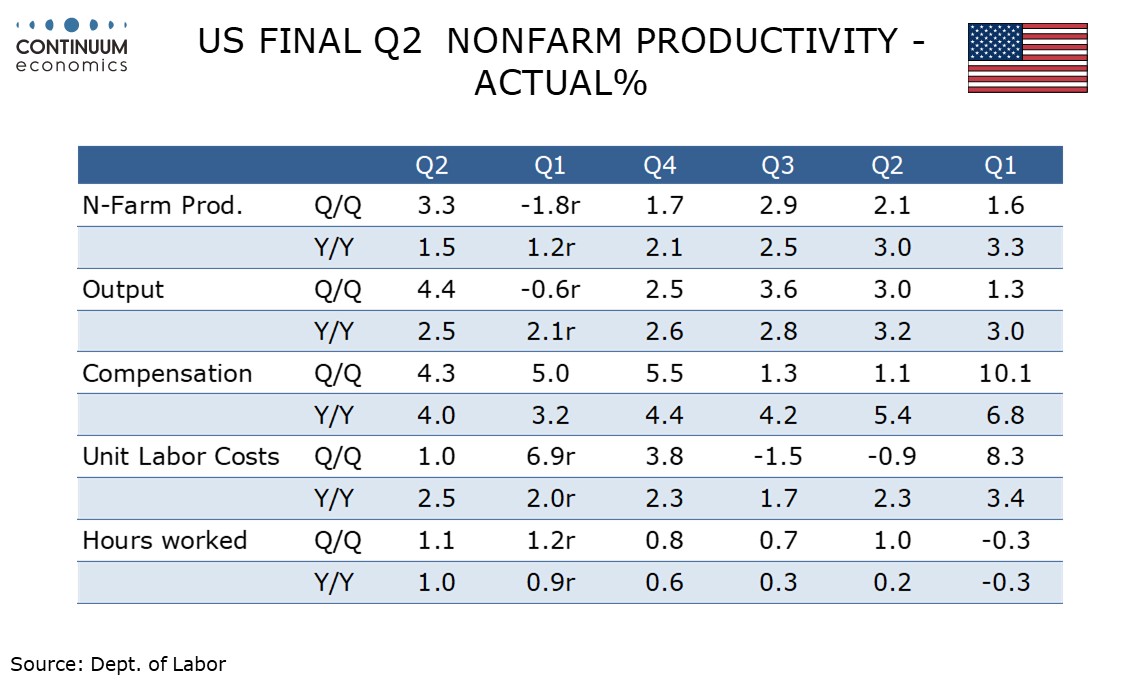
Q2 non-farm productivity saw a stronger than expected upward revision to 3.3% from 2.4%. Non-farm business output saw a stronger revision than GDP, to 4.4% from 3.7%, but this was already visible. Hours worked were revised down to 1.1% from 1.3%.
The unit labor cost downward revision to 1.0% from 1.6% was not quite as sharp as that for productivity with compensation revised up to 4.3% from 4.0%. With non-labor costs revised down to 2.0% from 2.5%, the deflator saw only a marginal downward revision, to 1.7% from 1.8%.