U.S. February PPI - Trend accelerating even before the energy shock
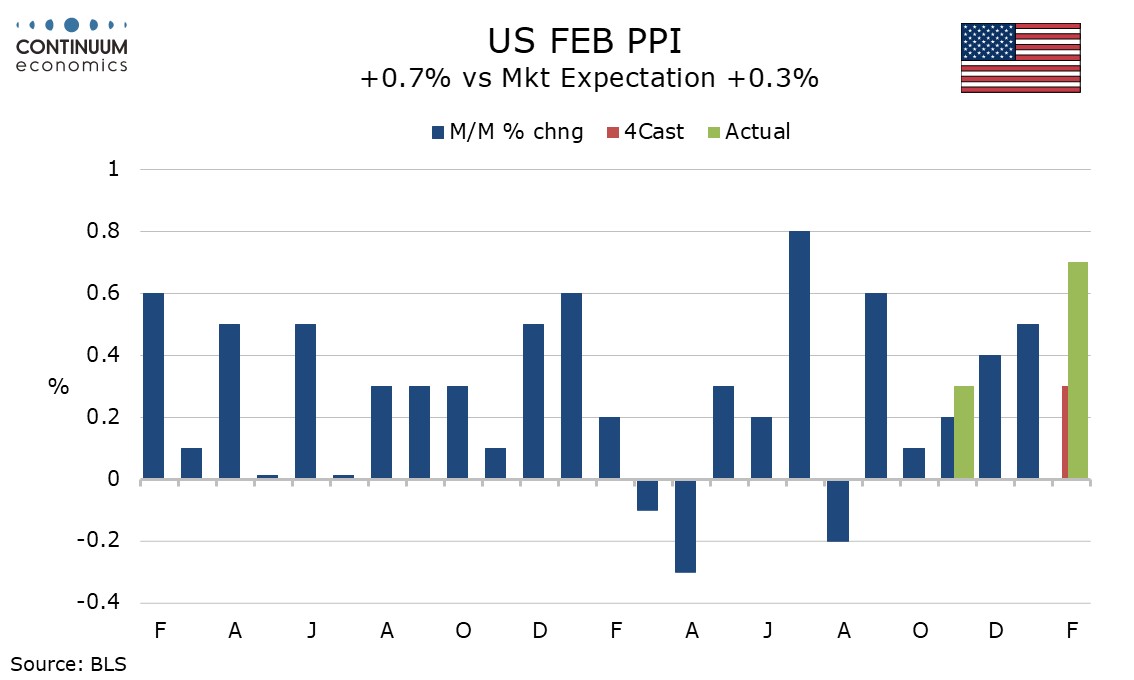
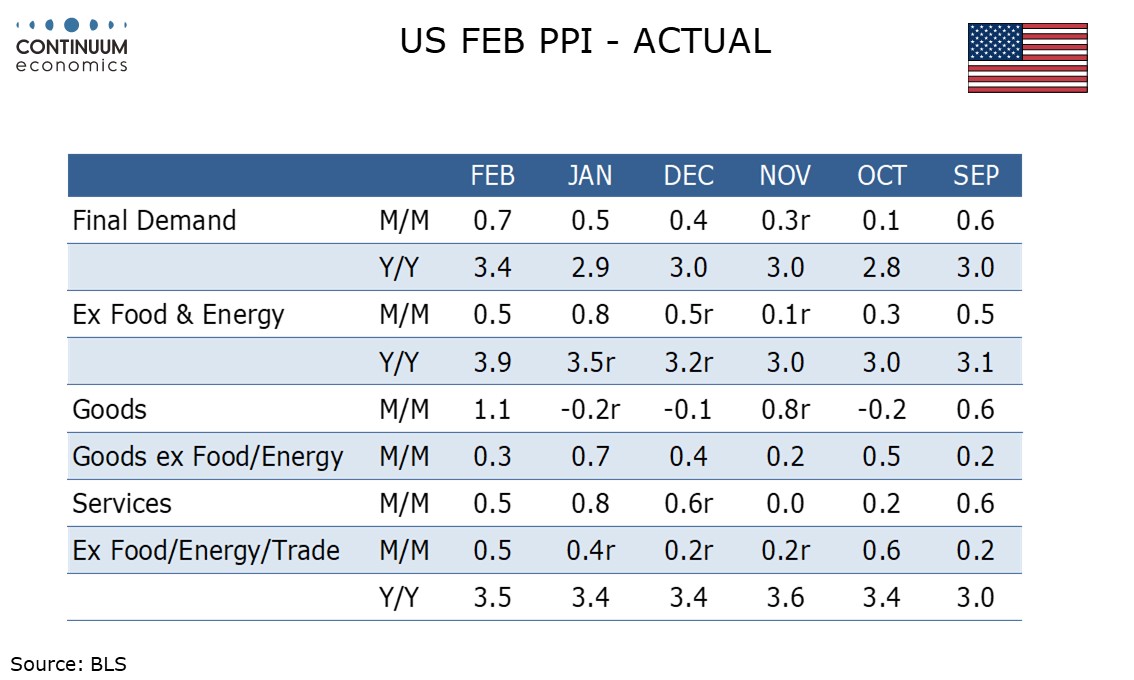
February PPI has seen another strong month, up 0.7% overall, 0.5%% ex food and energy and 0.5% in the less volatile ex food, energy and trade. March is sure to see a strong rise, at least in the headline, on energy. Trend seems to be picking up more than is the case for consumer prices, possibly related tin strong demand for investment.
The last two quarters have seen the GDP price index outperform PCE prices, with investment goods particularly strong in Q3 (in Q4 government was particularly strong, possibly related to the shutdown). Some have argued that strong investment will boost productivity and subdue inflation, but it may in fact be lifting investment prices.
Food with a 2.4% rise and energy at 2.3% both corrected two straight declines, food possibly influenced by weather. Energy is sure to surge in March. Goods ex food and energy rose a moderate 0.3% after a 0.7% January rise but this keeps trend quite firm.
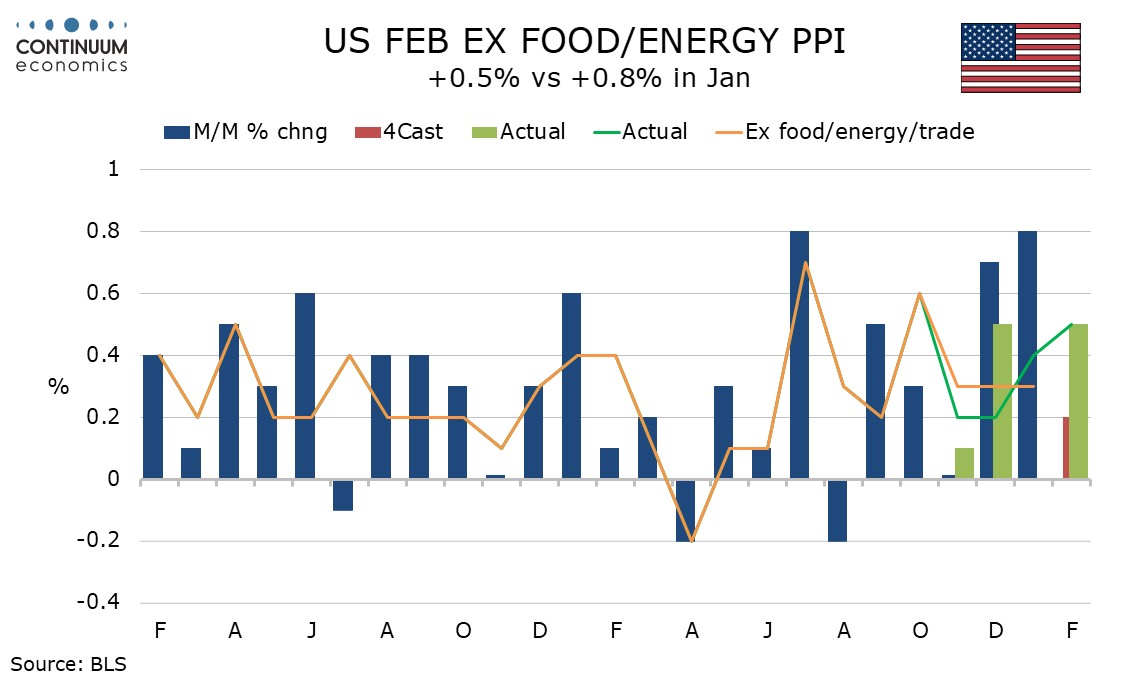
Services rose by 0.5% after a 0.8% January rise but the gain was less dependent on trade than in the last two months, with trade up 0.4%, transportation and warehousing up 0.5% and other services up by 0.6%. PPI ex food energy and trade rose by a 4-month high of 0.5% after a 0.4% gain in January and gains of only 0.2% in November and December.
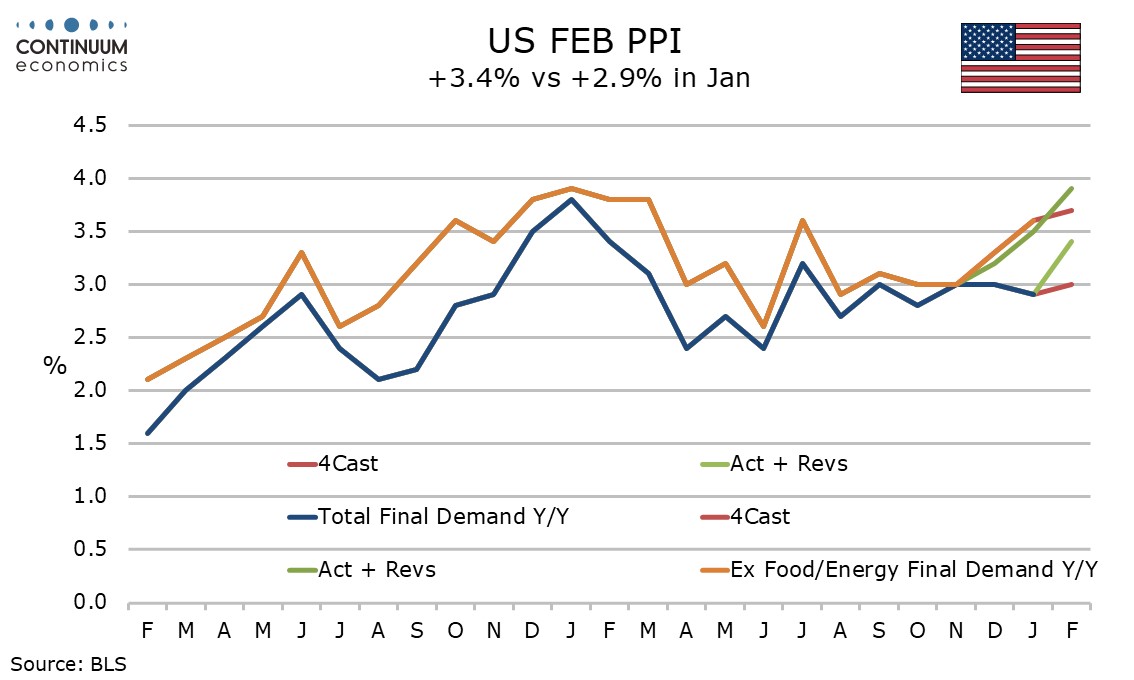
Yr/yr PPI at 3.4% from 2.9% is a 12-month high, while ex food and energy at 3.9% yr/yr from 3.5% is stronger still. Yr/yr PPI ex food, energy and trade at 3.5% from 3.4% has changed little in the last five months but has accelerated from a pace below 3.0% from April through July of 2025.
Intermediate PPI data shows plenty of pipeline inflation, with processed goods up by 1.6%, 0.8% less food and energy, unprocessed goods up by 3.1%, 1.1% ex food and energy, and services extending a recent acceleration with a surge of 0.8%.