Published: 2026-05-08T04:51:03.000Z
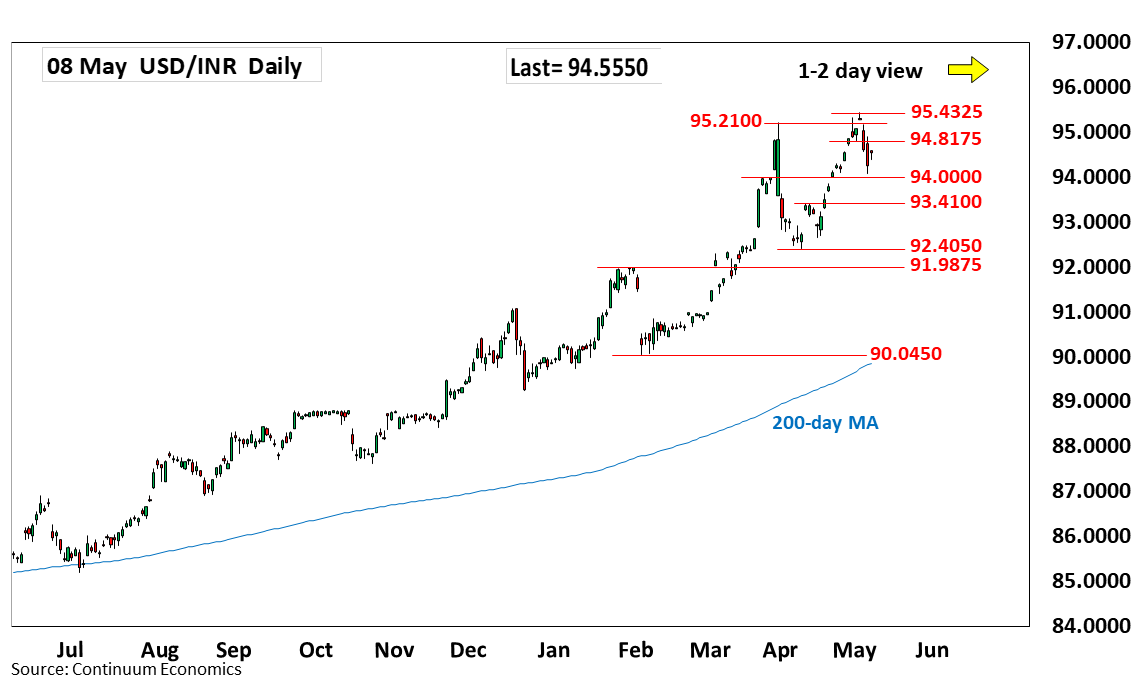
Chart USD/INR Update: Consolidating above 94.0000 figure
-
Turned up from the 94.0800 low as prices consolidate sharp drop from the 95.4325 all-time high
| Level | Comment | Level | Comment | |||||
|---|---|---|---|---|---|---|---|---|
| R4 | 95.5000 | projection | S1 | 94.0000 | ** | figure, congestion | ||
| R3 | 95.4325 | ** | 5 May all-time high | S2 | 93.4100 | ** | 15 Apr high | |
| R2 | 95.2100 | * | Mar high | S3 | 93.0000 | * | figure | |
| R1 | 94.8175 | * | 4 May low | S4 | 92.6500 | * | 17 Apr low |
Asterisk denotes strength of level
04:50 GMT - Turned up from the 94.0800 low as prices consolidate sharp drop from the 95.4325 all-time high. Consolidation is expected to give way to renewed selling pressure later with break of the 94.0000 level to turn focus to the downside and see room for deeper pullback to retrace gains from the 92.4050 April low. Lower will see room to strong support at 93.4100, 15 April high. Meanwhile, resistance is lowered to 94.8175 low of 4 May which is expected to cap corrective bounce and sustain losses from the 95.4325, 5 May all-time high.