Published: 2025-12-09T05:26:01.000Z
Chart USD/MYR Update: Edged up in consolidation
-
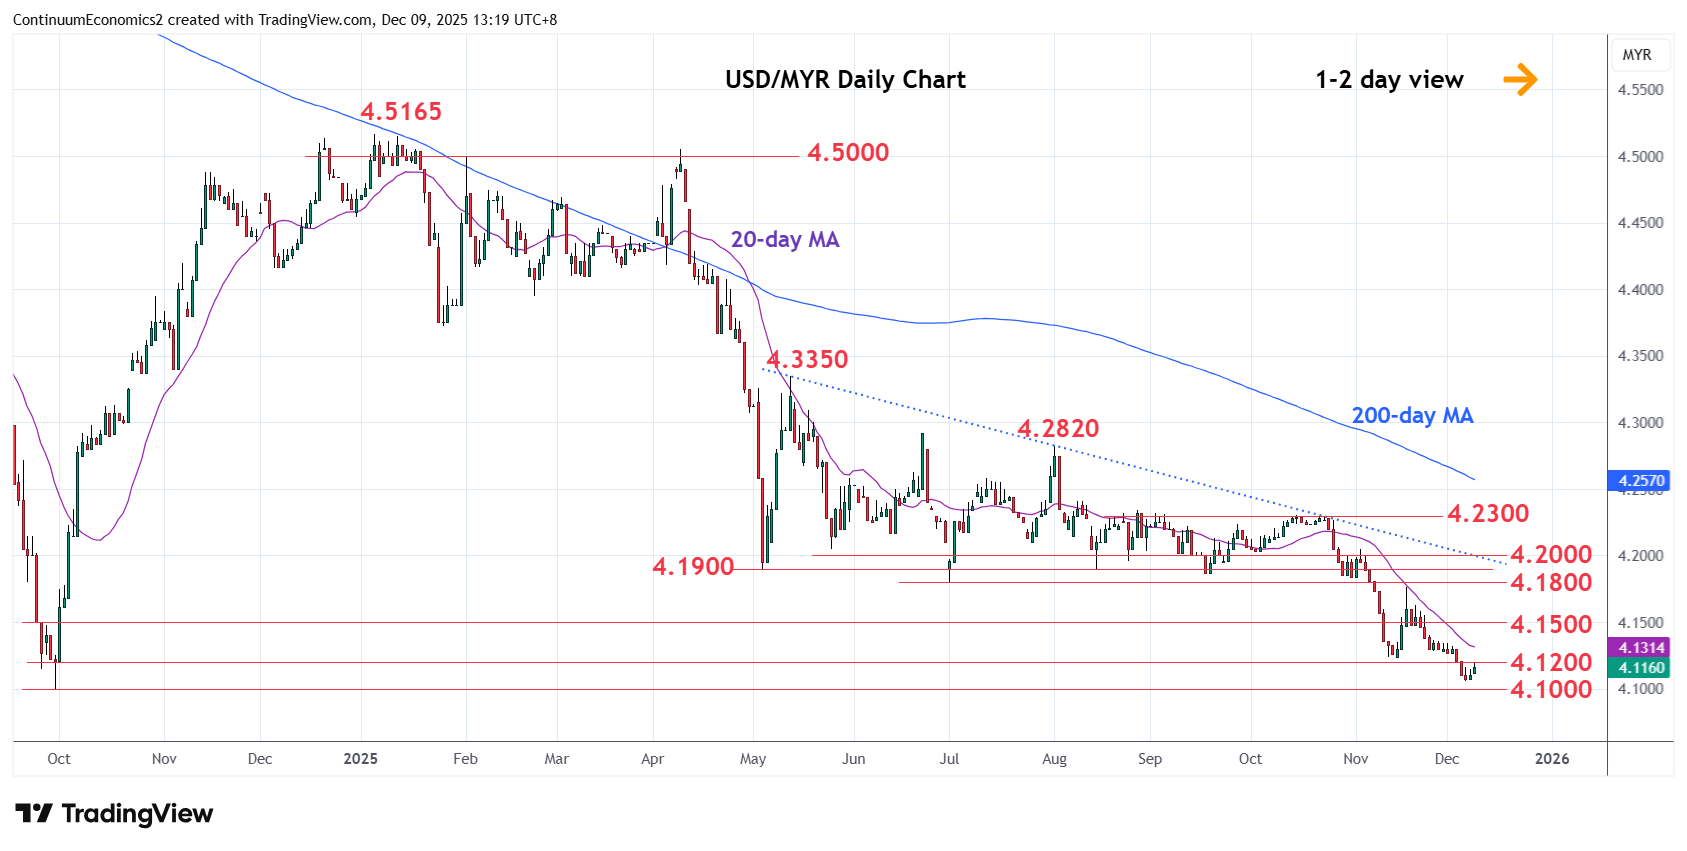
Edged up from the 4.1060 low to consolidate losses from the 4.1765, 18 November swing high
| Levels | Imp | Comment | Levels | Imp | Comment | |||
|---|---|---|---|---|---|---|---|---|
| R4 | 4.1900 | ** | May low | S1 | 4.1000 | ** | Sep 2024 year low | |
| R3 | 4.1800 | ** | Jul low | S2 | 4.0900 | * | Apr 2021 low | |
| R2 | 4.1470/00 | * | 18 Nov low, congestion | S3 | 4.0800 | * | congestion | |
| R1 | 4.1240 | ** | 14 Nov low | S4 | 4.0780 | * | 76.4% 2018/2024 rally |
Asterisk denotes strength of level
05:20 GMT - Edged up from the 4.1060 low to consolidate losses from the 4.1765, 18 November swing high. Prices are unwinding oversold intraday and daily studies but corrective bounce expected to give way to renewed selling pressure later. Below the 4.1060 low will see room to the 4.1000, September 2024 year low. Break here will further retrace the 2018/2024 rally and see room to support at 4.0780/7.0750, 76.4% Fibonacci level and congestion. Meanwhile, resistance is lowered to the 4.1240 November low which is expected to cap. Break here will open up room for stronger bounce to resistance at 4.1470/4.1500 area.