Published: 2026-05-12T02:49:28.000Z
Chart USD/MYR Update: Turned up from test of 3.9100/3.9000 support
2
Turned up from test of support at the 3.9100/3.9000 area as prices unwind oversold intraday and daily studies
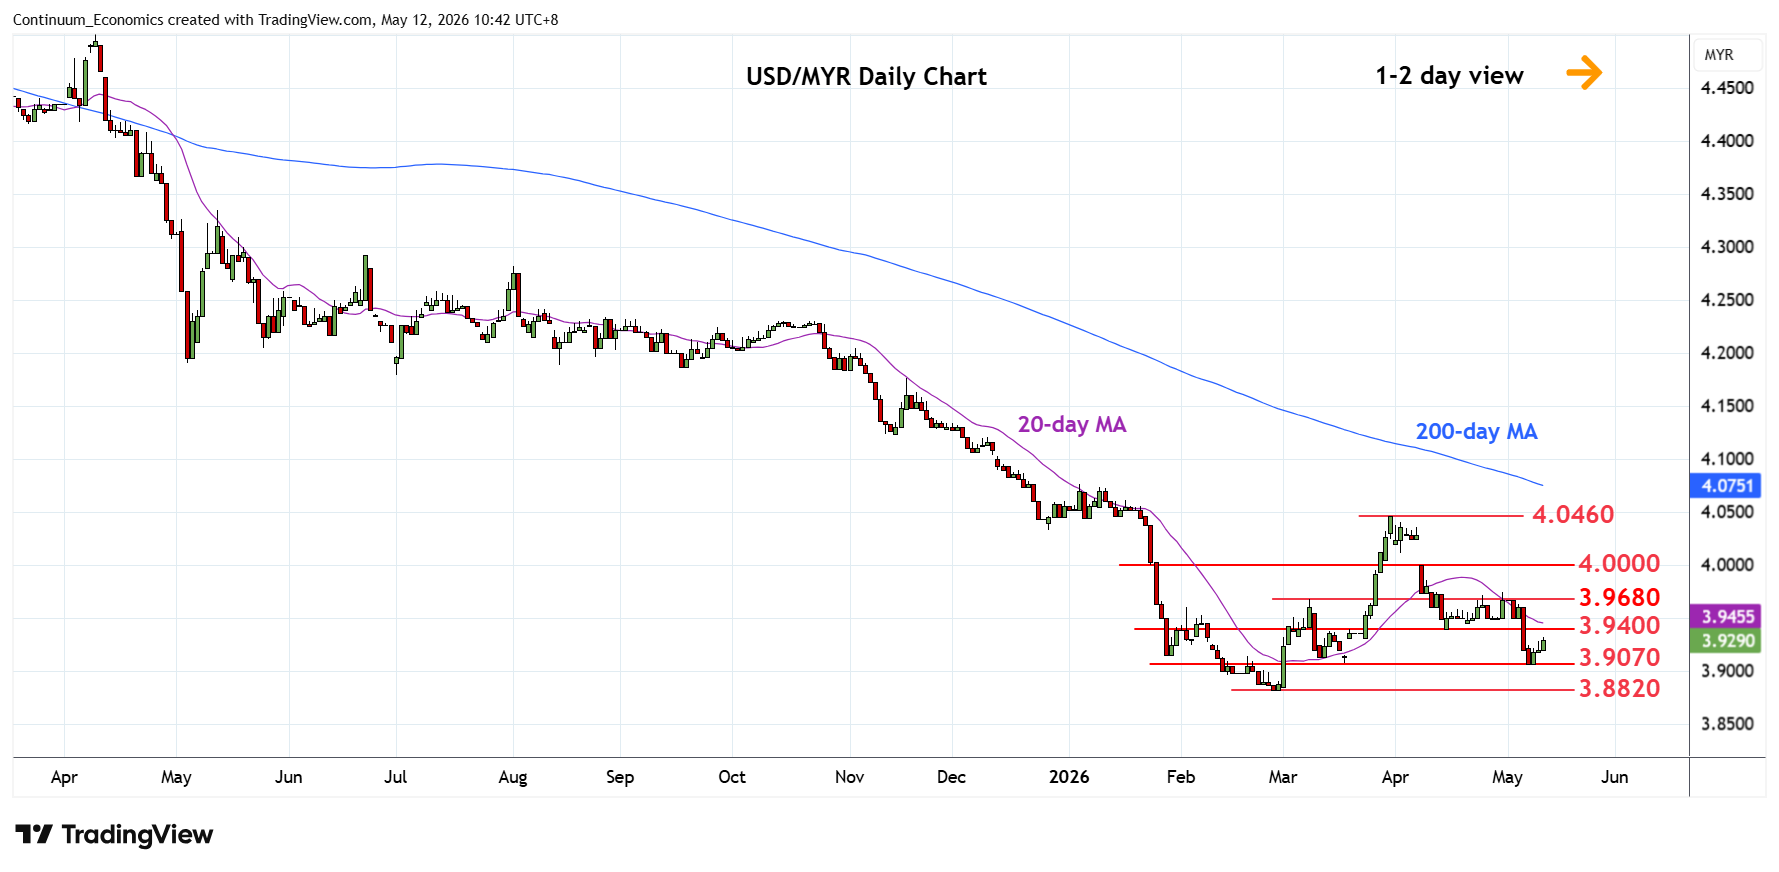
| Levels | Imp | Comment | Levels | Imp | Comment | |||
|---|---|---|---|---|---|---|---|---|
| R4 | 4.0200 | * | congestion | S1 | 3.9070 | * | 7 May low | |
| R3 | 4.0000 | * | figure | S2 | 3.8820 | ** | 26 Feb YTD low | |
| R2 | 3.9680 | * | 9 Mar high | S3 | 3.8680 | * | Jan 2018 low | |
| R1 | 3.9400 | ** | Apr low | S4 | 3.8560 | ** | Apr 2018 year low |
Asterisk denotes strength of level
02:45 GMT - Turned up from test of support at the 3.9100/3.9000 area as prices unwind oversold intraday and daily studies. Bounce see resistance at the 3.9400 April low which is expected to cap. Regaining this, if seen, will open up room for stronger corrective bounce to retrace losses from the 4.0460 March high to resistance at 3.9680. Corrective gains are expected to give way to renewed selling pressure later and break of the 3.9070 low and 3.9000 level will expose the 3.8820 February current year low to retest. Below this will see scope to further extend losses from the 2024 year high.