Published: 2026-05-14T04:00:32.000Z
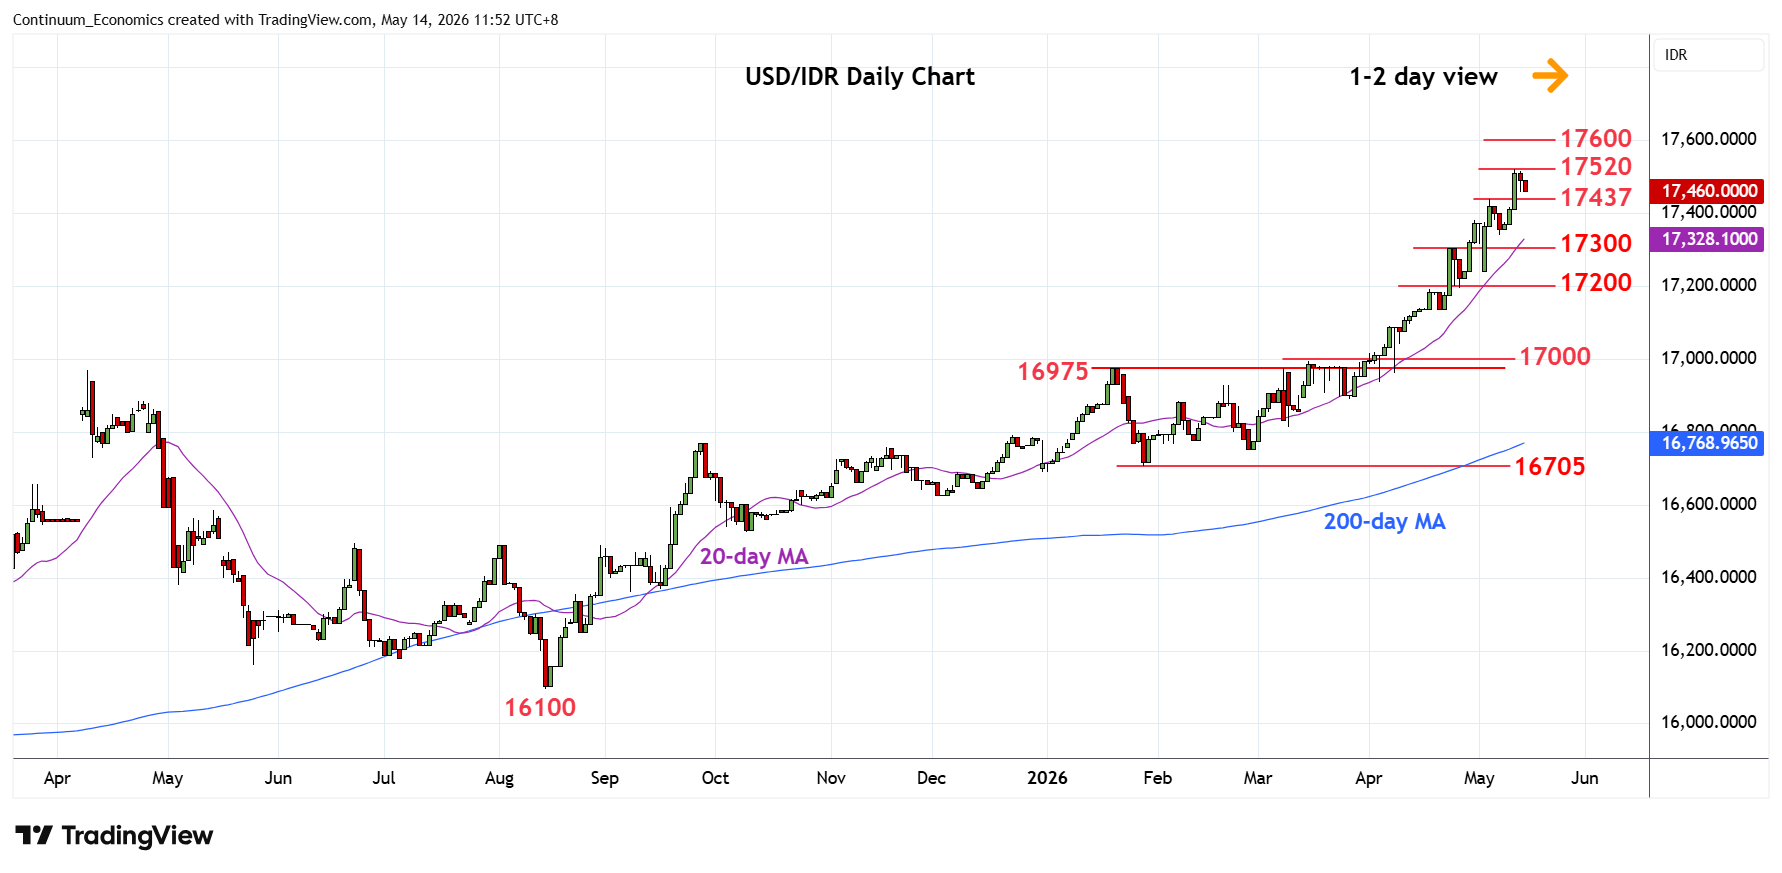
Chart USD/IDR Updates: Lower in range from historic high
2
Turned lower in range from 17520 Tuesday's historic high as prices consolidate recent parabolic gains from the January low
| Levels | Imp | Comment | Levels | Imp | Comment | |||
|---|---|---|---|---|---|---|---|---|
| R4 | 18000 | figure | S1 | 17437 | * | 5 May high | ||
| R3 | 17800 | projection | S2 | 17300 | * | 23 Apr high | ||
| R2 | 17600 | projection | S3 | 17240/200 | * | 4 May low, congestion | ||
| R1 | 17520 | ** | 12 May all-time high | S4 | 17100/090 | ** | congestion, 7 Apr high |
Asterisk denotes strength of level
04:00 GMT - Turned lower in range from 17520 Tuesday's historic high as prices consolidate parabolic gains from the January low. Stronger gains cannot be ruled out from the 16705 January year low, higher will see room to 17600 and 17800 projection targets. Overbought daily and weekly studies caution corrective pullback with support now raised to the 17437/17400 congestion area. Break here will open up room for deeper corrective pullback to support at the 17300 congestion and the 17240/17200 area.