Continuum Economics
  • Search
  • About Us
  • Buy
  • Invite A Friend
  • My Basket
  • Articles
  • Calendar
  • Forecasts
  • Events
  • Data
  • Newsletters
  • My Alerts
  • Community
  • Directory
  • About Us
  • Buy
  • Invite A Friend
  • My Basket
  • Articles
    • All
    • Thematic
    • Tactical
    • Asia
    • EMEA
    • Americas
    • Newsletters
    • Freemium
    • Editor's Choice
    • Most Viewed
    • Most Shared
    • Most Liked
  • Calendar
    • Interactive
      • China
      • United States
      • Eurozone
      • United Kingdom
    • Month Ahead
    • Reviews
    • Previews
  • Forecasts
    • Forecasts
    • Key Views
  • Events
    • Media
    • Conference Calls
  • Data
    • Country Insights
    • Shadow Credit Ratings
    • Full CI Data Download
  • Newsletters
  • My Alerts
  • Community
    • FX
    • Fixed Income
    • Macro Strategy
    • Credit Markets
    • Equities
    • Commodities
    • Precious Metals
    • Renewables
  • Directory
  • My Account
  • Notifications Setup
  • Administration Panel
  • Account Details
  • Recent Devices
  • Distribution Lists
  • Shared Free Trials
  • Saved Articles
  • Shared Alerts
  • My Posts
Published: 2025-12-12T13:42:04.000Z

Chartbook: Chart USD Index DXY: Range extension before lower levels attract

1

Anticipated consolidation above the 96.22 current year low of 17 September has given way to a corrective bounce

Anticipated consolidation above the 96.22 current year low of 17 September has given way to a corrective bounce to strong resistance at the base of the multi-month distribution top around 100.00.

Fresh selling interest is pushing prices lower once again, but mixed monthly charts are expected to limit initial scope in consolidation/range extension above critical support at 96.22.

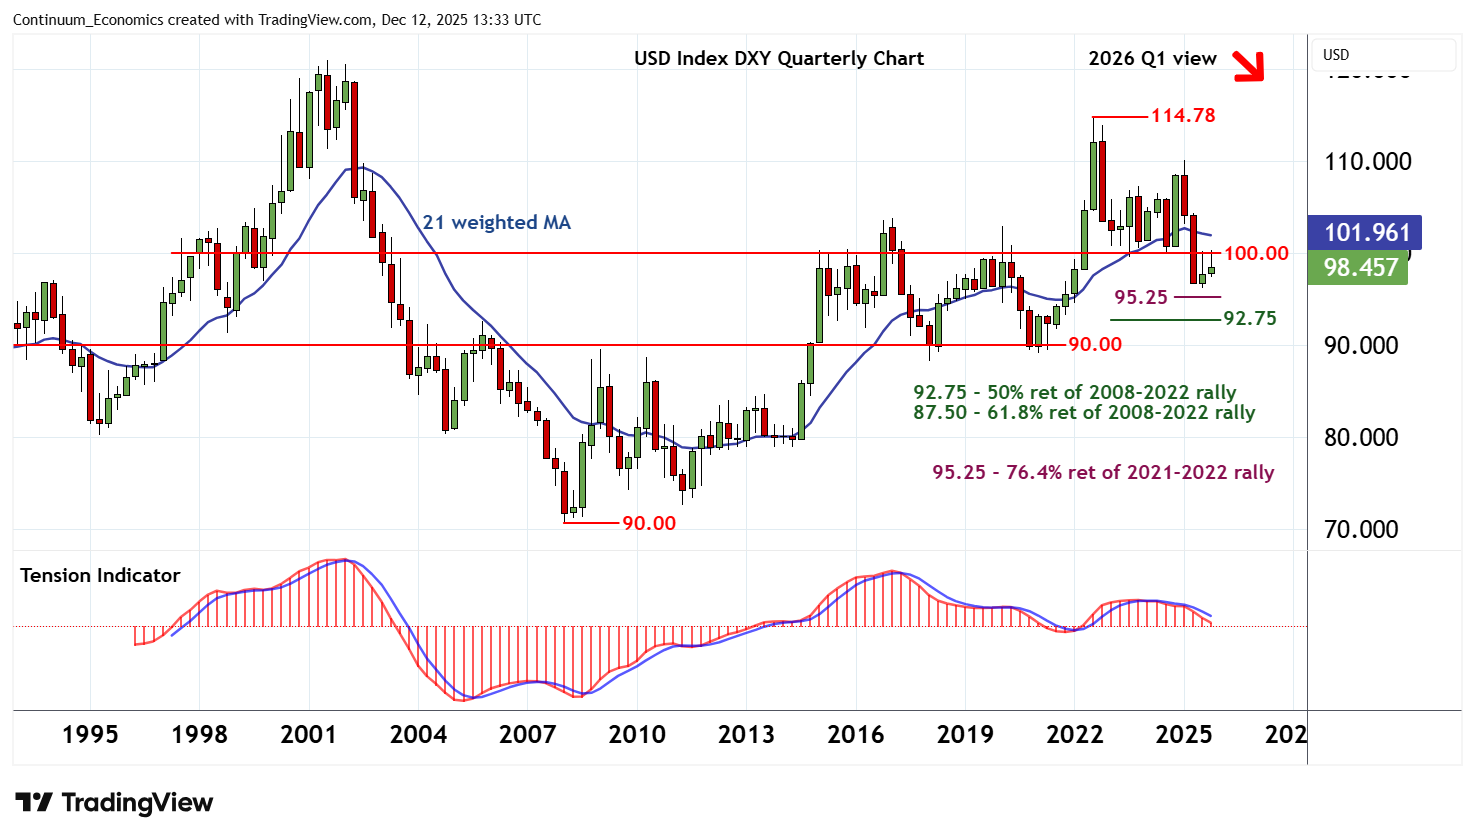
Longer-term studies are bearish, however, pointing to a later break beneath here.

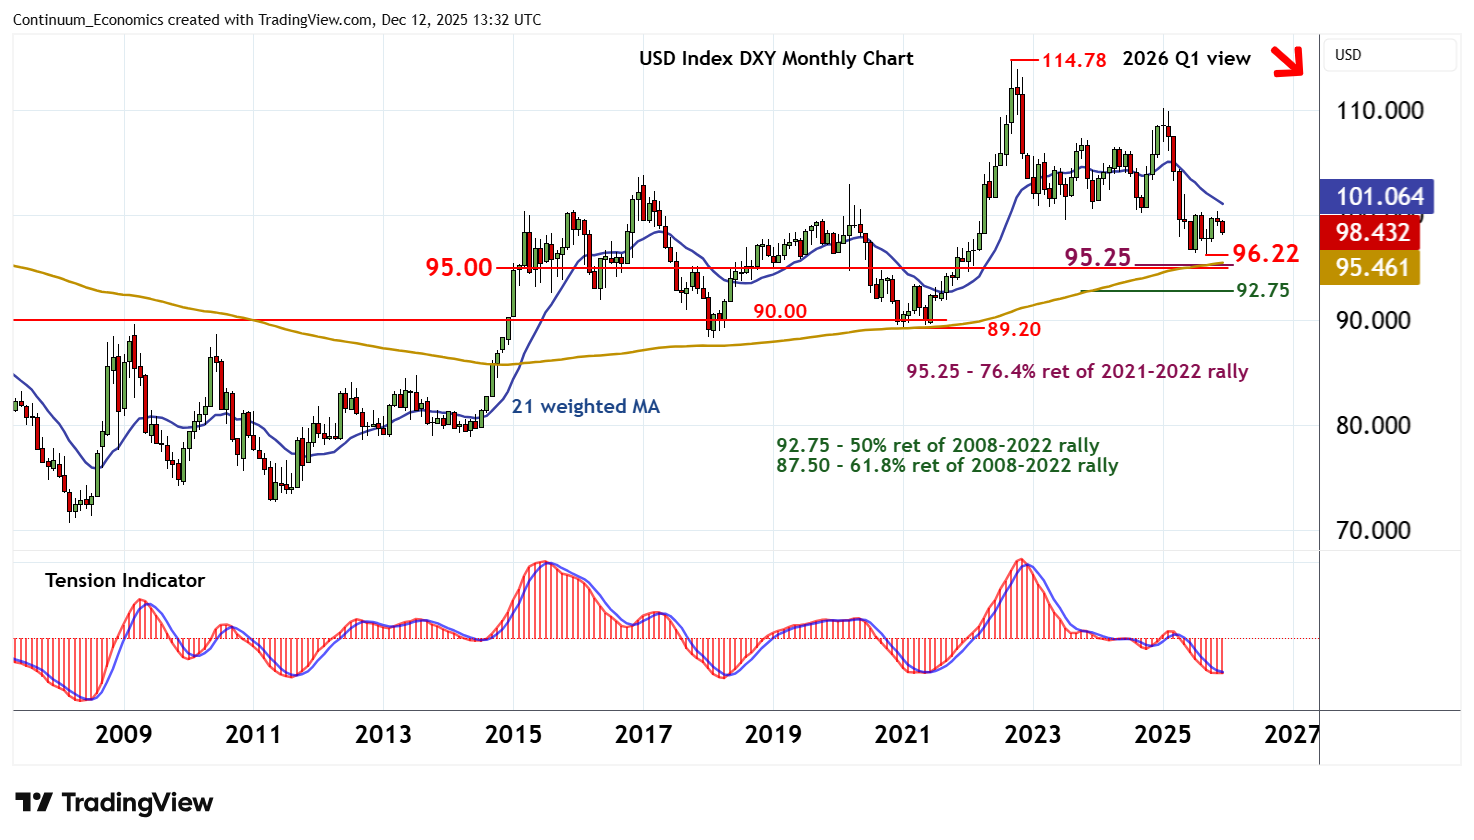
A close below 96.22 will turn sentiment negative and complete a multi-month distribution pattern beneath 100.00, as losses from the 114.78 multi-year high of September 2022 extend towards the 95.25 Fibonacci retracement and congestion around 95.00.

Further selling will open up the 92.75 multi-year retracement.

Meanwhile, immediate resistance is at the 100.00 base of the multi-month distribution top.

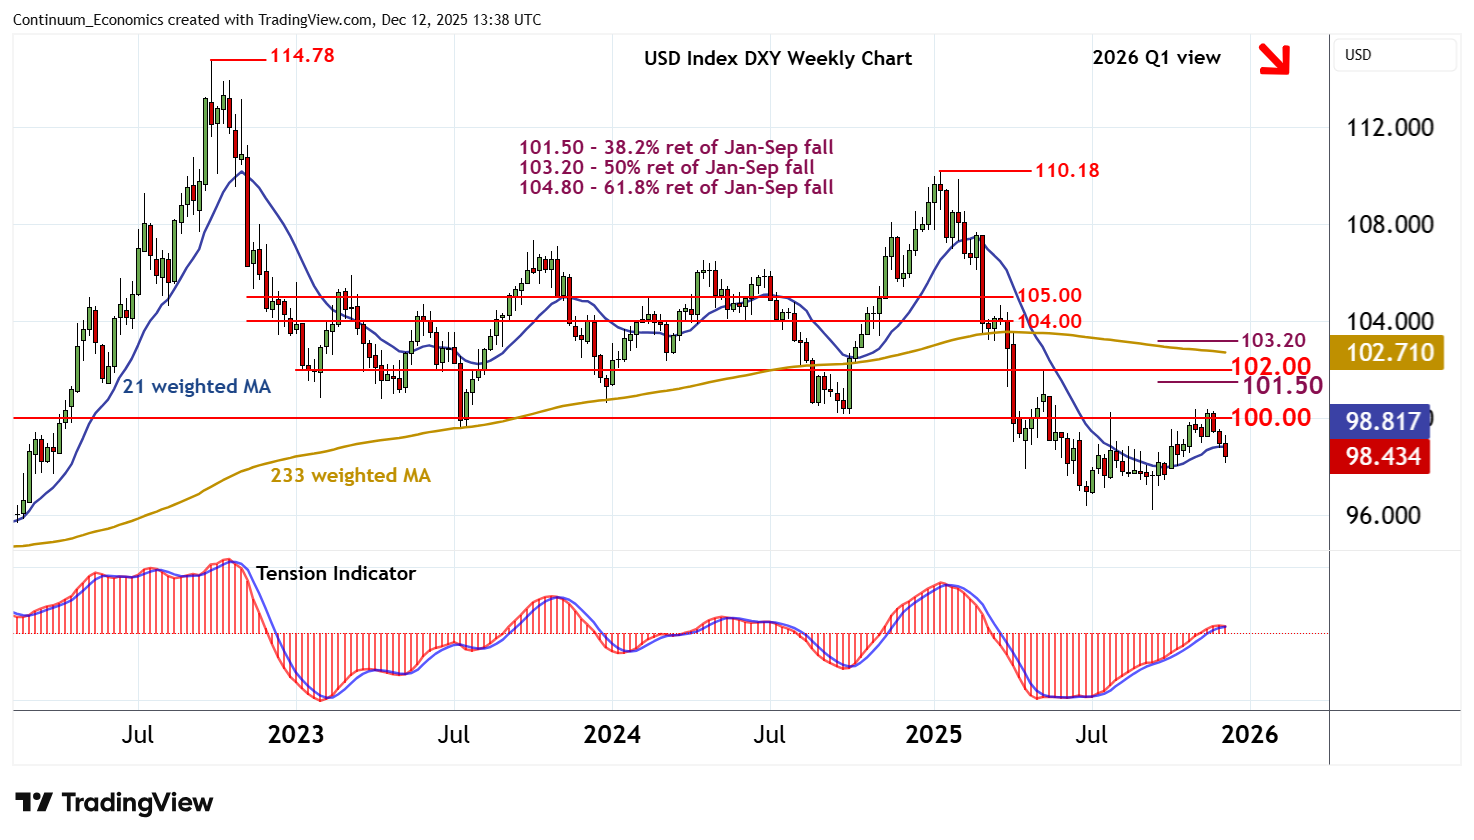
A close above here, if seen, would delay lower levels and give way to consolidation beneath the 101.50 Fibonacci retracement and the 102.00 break level.

A further close above here, not seen, would signal a more significant corrective bounce within the 2025 bear trend, and open up the 103.20 retracement, where fresh selling interest is expected to appear.

Continue to read the article for free
Login

or

or

Topics
DXY-TA
Technical Analysis
ChartBook
Editor's Choice

GENERAL

  • Home
  • About Us
  • Our Team
  • Careers

LEGAL

  • Terms and Conditions
  • Privacy Policy
  • Compliance
  • GDPR

GET IN TOUCH

  • Contact Us
Continuum Economics
The Technical Analyst Awards Winner 2021
The Technical Analyst Awards Finalist 2020
image