Chart EUR/CAD Update: Spike lower not sustained - studies under pressure
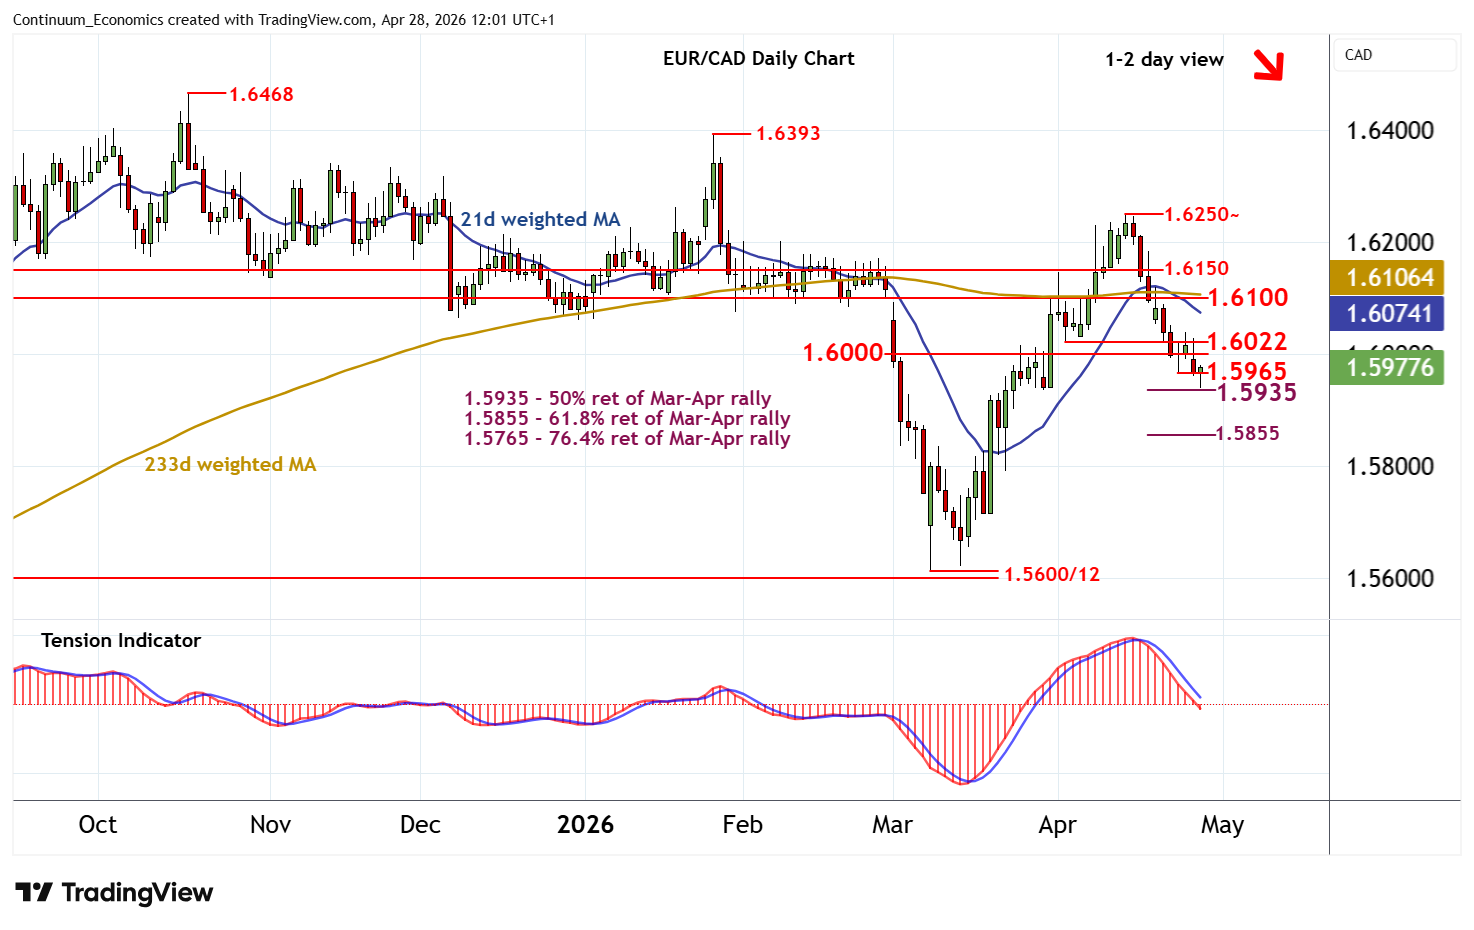
The test below 1.5965 has bounced smartly from above the 1.5935 Fibonacci retracement
| Level | Comment | Level | Comment | |||||
|---|---|---|---|---|---|---|---|---|
| R4 | 1.6150 | * | congestion | S1 | 1.5965 | ** | 23 Apr (w) low | |
| R3 | 1.6100 | ** | break level | S2 | 1.5935 | ** | 50% ret of Mar-Apr rally | |
| R2 | 1.6022 | * | 2-6 Apr lows | S3 | 1.5900 | congestion | ||
| R1 | 1.6000 | * | break level | S4 | 1.5855 | ** | 61.8% ret of Mar-Apr rally |
Asterisk denotes strength
11:40 BST - The test below 1.5965 has bounced smartly from above the 1.5935 Fibonacci retracement, as oversold intraday studies flatten, with prices once again trading above 1.5965. Oversold daily stochastics are edging higher, suggesting room for a test of resistance at 1.6000. But the negative daily Tension Indicator and deteriorating weekly charts should prompt renewed selling interest towards here. A close above the 1.6022 lows of 2-6 April, however, would improve sentiment and give way to consolidation beneath 1.6100. Following cautious trade, fresh losses are looked for. But a close below 1.5935 is needed to turn sentiment negative and extend mid-April losses towards the 1.5855 retracement.