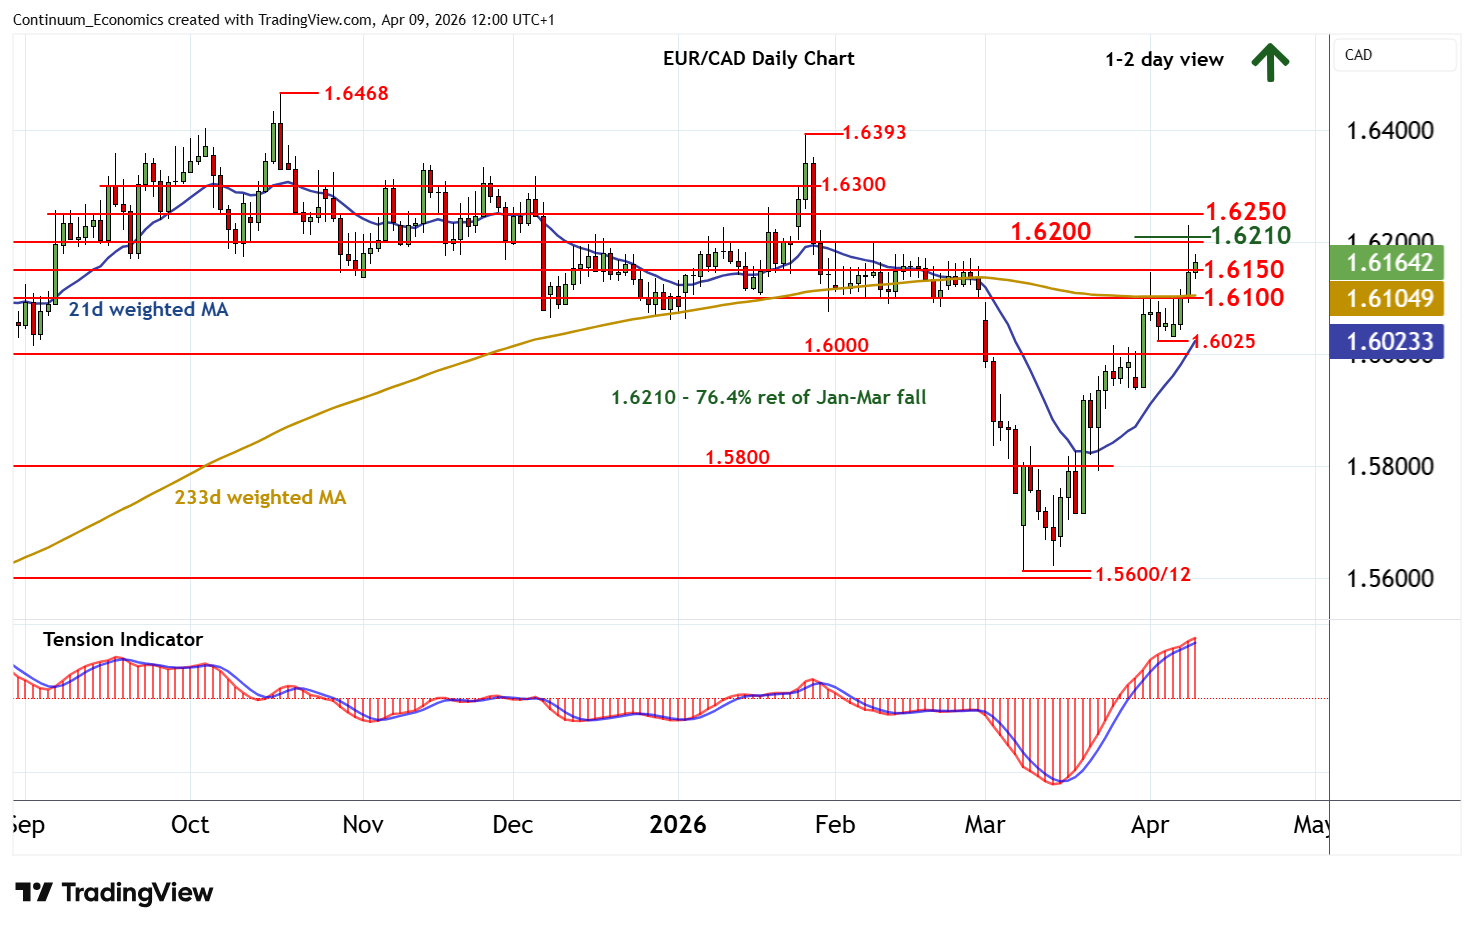
Chart EUR/CAD Update: Sharp pullback, but studies continue to rise
The test of strong resistance at congestion around 1.6200 and the 1.6210 Fibonacci retracement has given way to a pullback to 1.6135
| Level | Comment | Level | Comment | |||||
|---|---|---|---|---|---|---|---|---|
| R4 | 1.6393 | ** | 27 Jan YTD high | S1 | 1.6150 | * | congestion | |
| R3 | 1.6300 | * | congestion | S2 | 1.6100 | ** | break level | |
| R2 | 1.6250 | congestion | S3 | 1.6025 | * | recent lows | ||
| R1 | 1.6200/10 | ** | congestion; 76.4% ret | S4 | 1.6000 | ** | congestion |
Asterisk denotes strength
11:30 BST - The test of strong resistance at congestion around 1.6200 and the 1.6210 Fibonacci retracement has given way to a pullback to 1.6135, where fresh buying interest is appearing. Daily readings continue to rise and broader weekly charts are also positive, highlighting room for a retest of 1.6200/10. A close above here will extend March gains towards congestion around 1.6250. However, already overbought daily stochastics could limit any immediate continuation beyond here in profit-taking towards further congestion around 1.6300. Meanwhile, support remains at 1.6150. A close beneath here, if seen, will stabilise sentiment and prompt consolidation above support at 1.6100.