Published: 2026-04-09T03:01:56.000Z
Chart USD/THB Update: Consolidating at 31.89 support
1
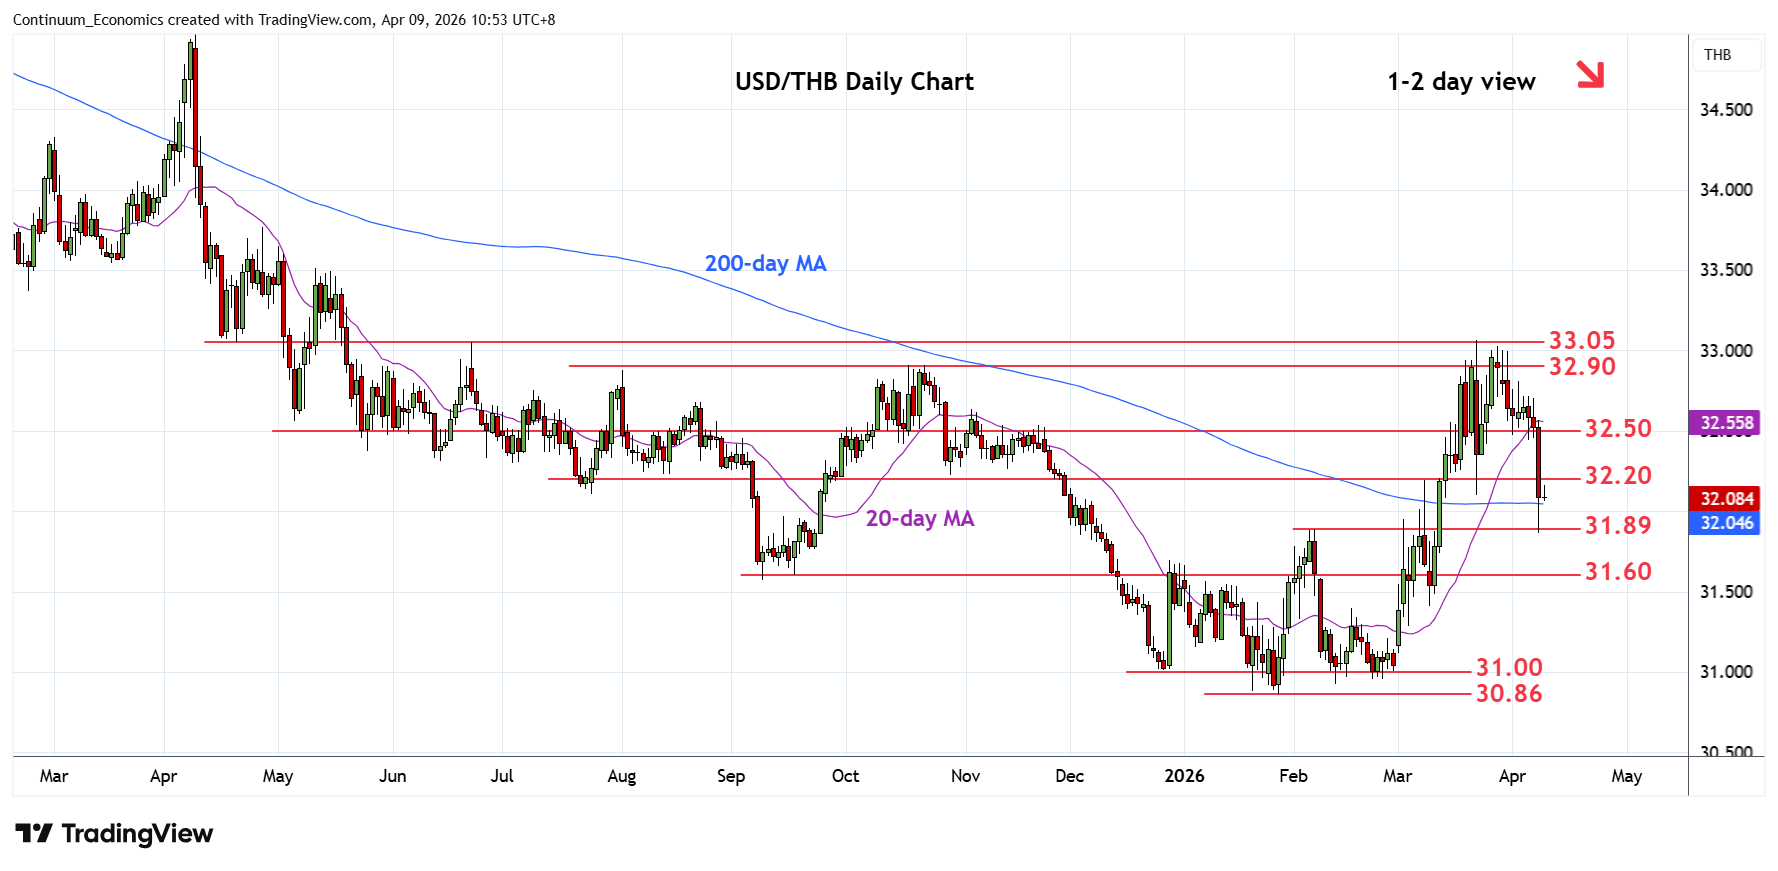
Break of the 32.50/35 support has seen sharp dive through the 32.00 level to reach support at 31.89, February high
| Level | Comment | Level | Comment | |||||
|---|---|---|---|---|---|---|---|---|
| R4 | 32.60 | * | congestion | S1 | 32.00 | * | congestion | |
| R3 | 32.50 | * | congestion | S2 | 31.89 | ** | Feb high | |
| R2 | 32.35 | * | 24 Mar low | S3 | 31.80 | congestion | ||
| R1 | 32.20 | * | congestion | S4 | 31.60/58 | ** | congestion, 2025 yr low |
Asterisk denotes strength of level
03:00 GMT - Break of the 32.50/35 support has seen sharp dive through the 32.00 level to reach support at 31.89, February high. Consolidation here see prices unwinding the stretched intraday studies but negative daily and weekly studies suggest this giving way to renewed selling pressure later. Lower will further extend the March losses to the 31.80 congestion then strong support at the 31.60/58 area. Meanwhile, resistance is lowered to 32.20 congestion which is expected to cap and sustain losses from the 33.05, March current year high.