Published: 2026-04-10T06:41:49.000Z
Chart USD/TWD Update: Weighing on 31.700 support
2
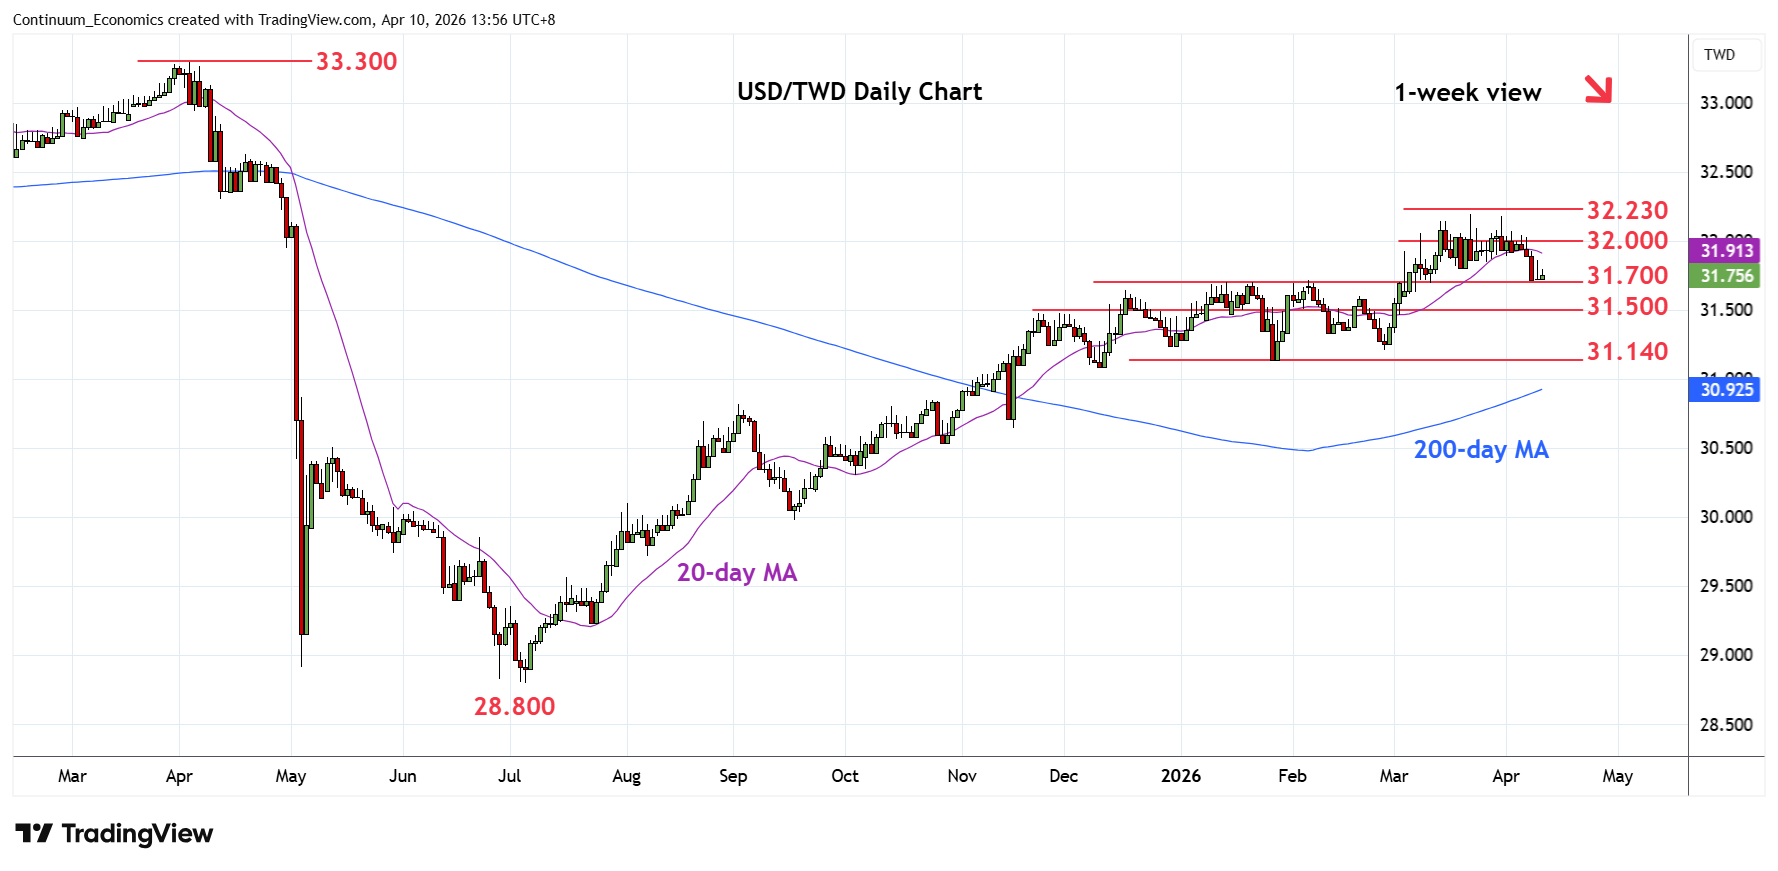
Turned lower from beneath the 32.230, 76.4% Fibonacci retracement as prices unwind overbought daily studies
| Levels | Imp | Comment | Levels | Imp | Comment | |||
|---|---|---|---|---|---|---|---|---|
| R4 | 32.300 | * | 11 Apr 2025 low | S1 | 31.700 | ** | Jan high | |
| R3 | 32.230 | * | 76.4% Apr/Jul fall | S2 | 31.500 | * | congestion | |
| R2 | 32.200 | ** | 23 Mar YTD high | S3 | 31.200 | * | Feb low | |
| R1 | 32.000 | * | figure | S4 | 31.140 | ** | 27 Jan YTD low |
06:40 GMT - Turned lower from beneath the 32.230, 76.4% Fibonacci retracement, as prices unwind overbought daily studies. Pullback see has since found support at the 31.700 January high. However, negative daily and weekly studies suggest consolidation here expected to give way to renewed selling pressure later. Lower will see room for deeper pullback to retrace gains from the 28.800, July 2025 year low, to support at the 31.500 congestion. Lower still, will see room to strong support at 31.200/31.140, February/January lows. Meanwhile, resistance is lowered to the 32.000 figure which should cap and sustain losses from 32.200 high.