Published: 2025-10-16T05:46:06.000Z
Chart USD/INR Update: Extending losses
2
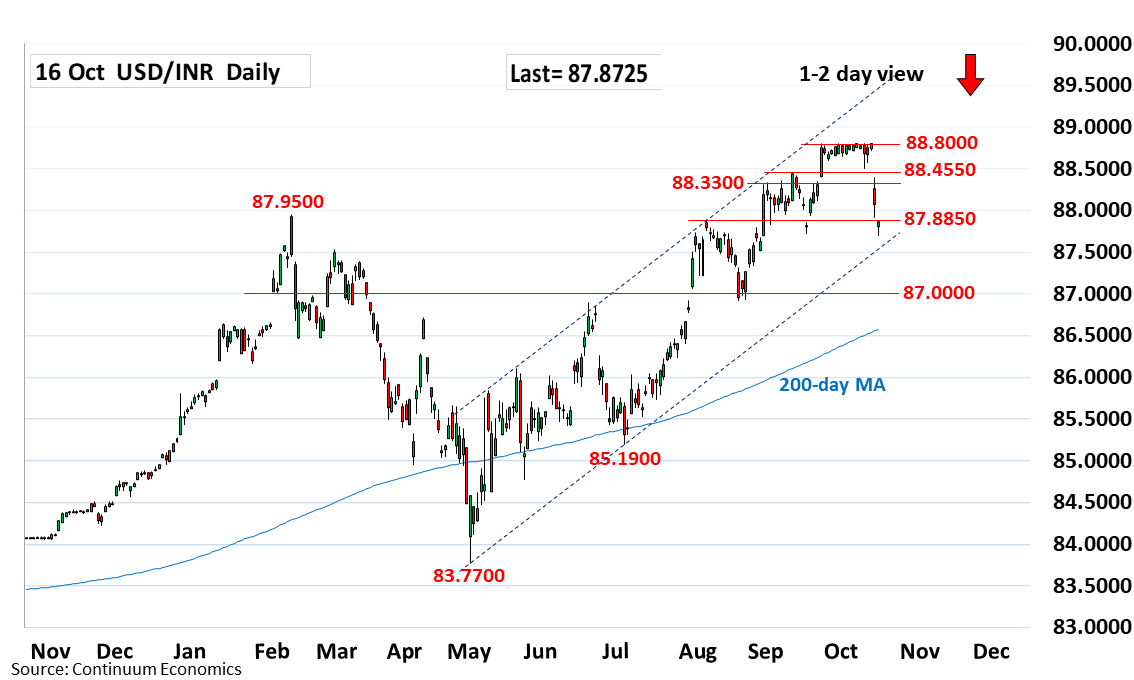
Extending sharp losses from the 88.8000 all-time high with break of the 88.0000/87.8850 support reaching 87.7000 low
| Level | Comment | Level | Comment | |||||
|---|---|---|---|---|---|---|---|---|
| R4 | 88.5000 | ** | 10 Oct low | S1 | 87.5000 | * | congestion | |
| R3 | 88.4550 | * | Sep high | S2 | 87.4200 | * | 38.2% Jul/Sep rally | |
| R2 | 88.3300 | * | 1 Sep high | S3 | 87.0000 | * | congestion, 50% | |
| R1 | 88.0000 | * | figure | S4 | 86.9200 | ** | Aug low |
Asterisk denotes strength of level
05:40 GMT - Extending sharp losses from the 88.8000 all-time high with break of the 88.0000/87.8850 support reaching 87.7000 low. Consolidation here see prices unwinding oversold intraday studies but negative daily studies suggest scope for break here later to open up room for deeper pullback to retrace strong gains from the 85.1900, July low. Lower will see room to 87.4200, 38.2% Fibonacci level then the 87.0000 figure. Resistance is lowered to 88.0000 level which is expected to limit corrective bounce and sustain losses from the 88.8000 high.