Published: 2025-11-26T02:43:30.000Z
Chart USD/THB Update: Under pressure, 32.23 October low at risk
1
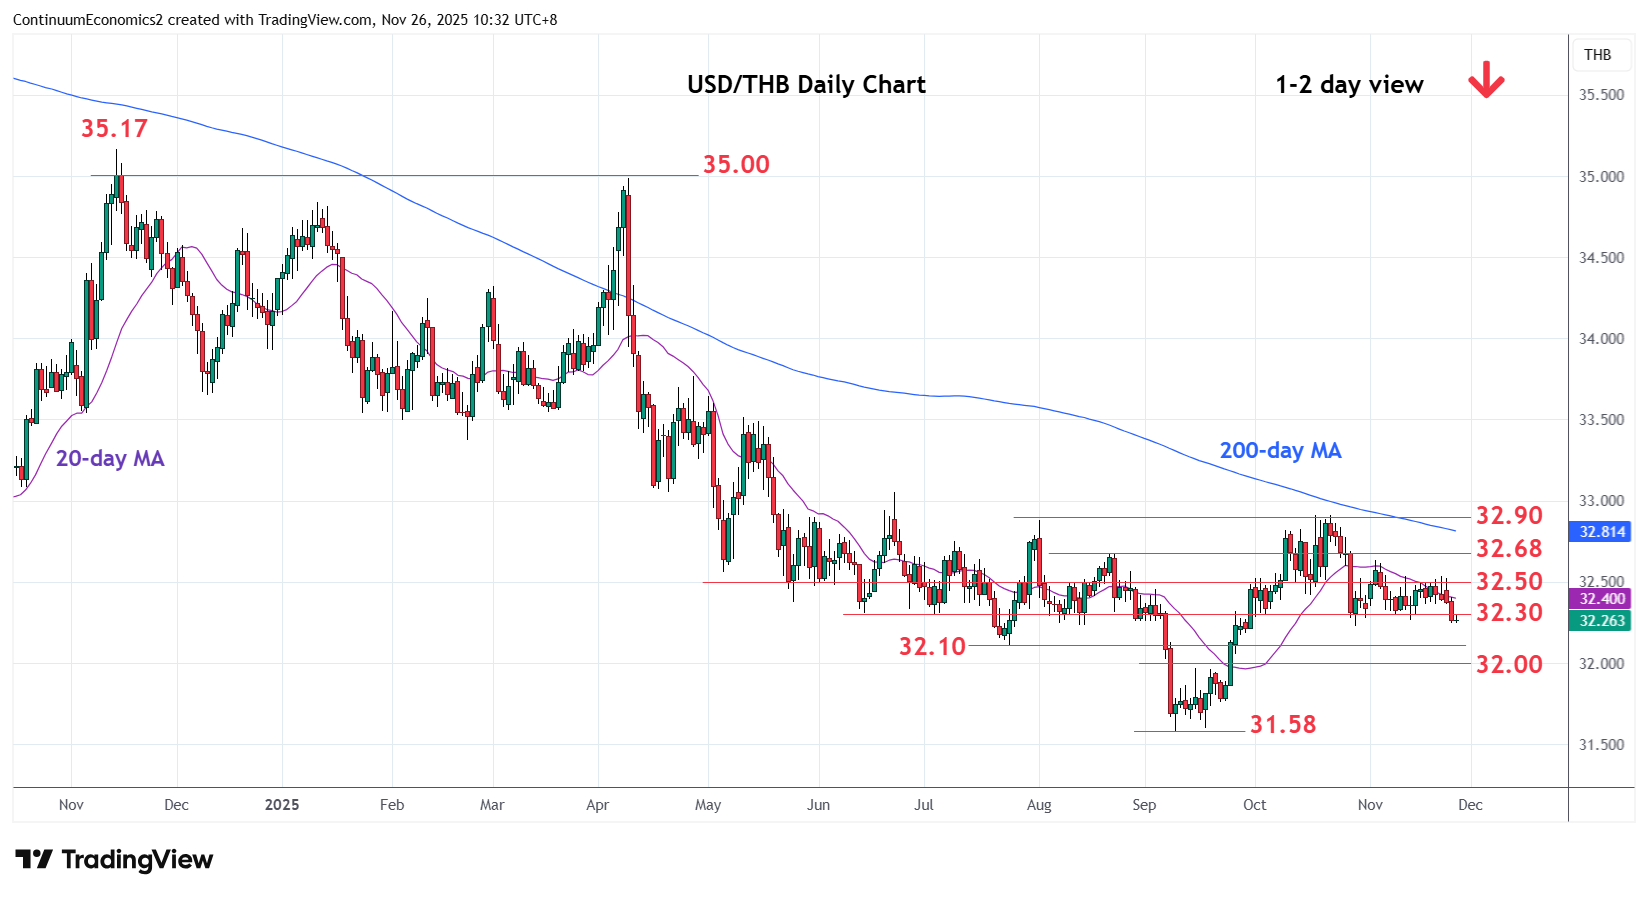
Under pressure, as choppy trade within the 32.50/32.30 area gave way to selling pressure
| Level | Comment | Level | Comment | |||||
|---|---|---|---|---|---|---|---|---|
| R4 | 32.68 | * | 22 Aug high | S1 | 32.23 | * | Oct low | |
| R3 | 32.63 | ** | 4 Nov high | S2 | 32.10 | ** | Jul low | |
| R2 | 32.50 | * | congestion | S3 | 32.00 | * | figure | |
| R1 | 32.30 | * | congestion | S4 | 31.76 | 22 Sep low |
Asterisk denotes strength of level
02:40 GMT - Under pressure, as choppy trade within the 32.50/32.30 area gave way to selling pressure. Break of the 32.30 level see the October low at 32.23 now at risk. Break here will see room for deeper pullback to extend rejection from the 32.90/32.91 October high to strong support at the 32.10 July low and the 32.00 figure. Below these will return focus to the 31.58, September current year low. Meanwhile, resistance is lowered to the 32.30/50 congestion area which is expected to cap and sustains losses from the 32.90/91, October swing high.