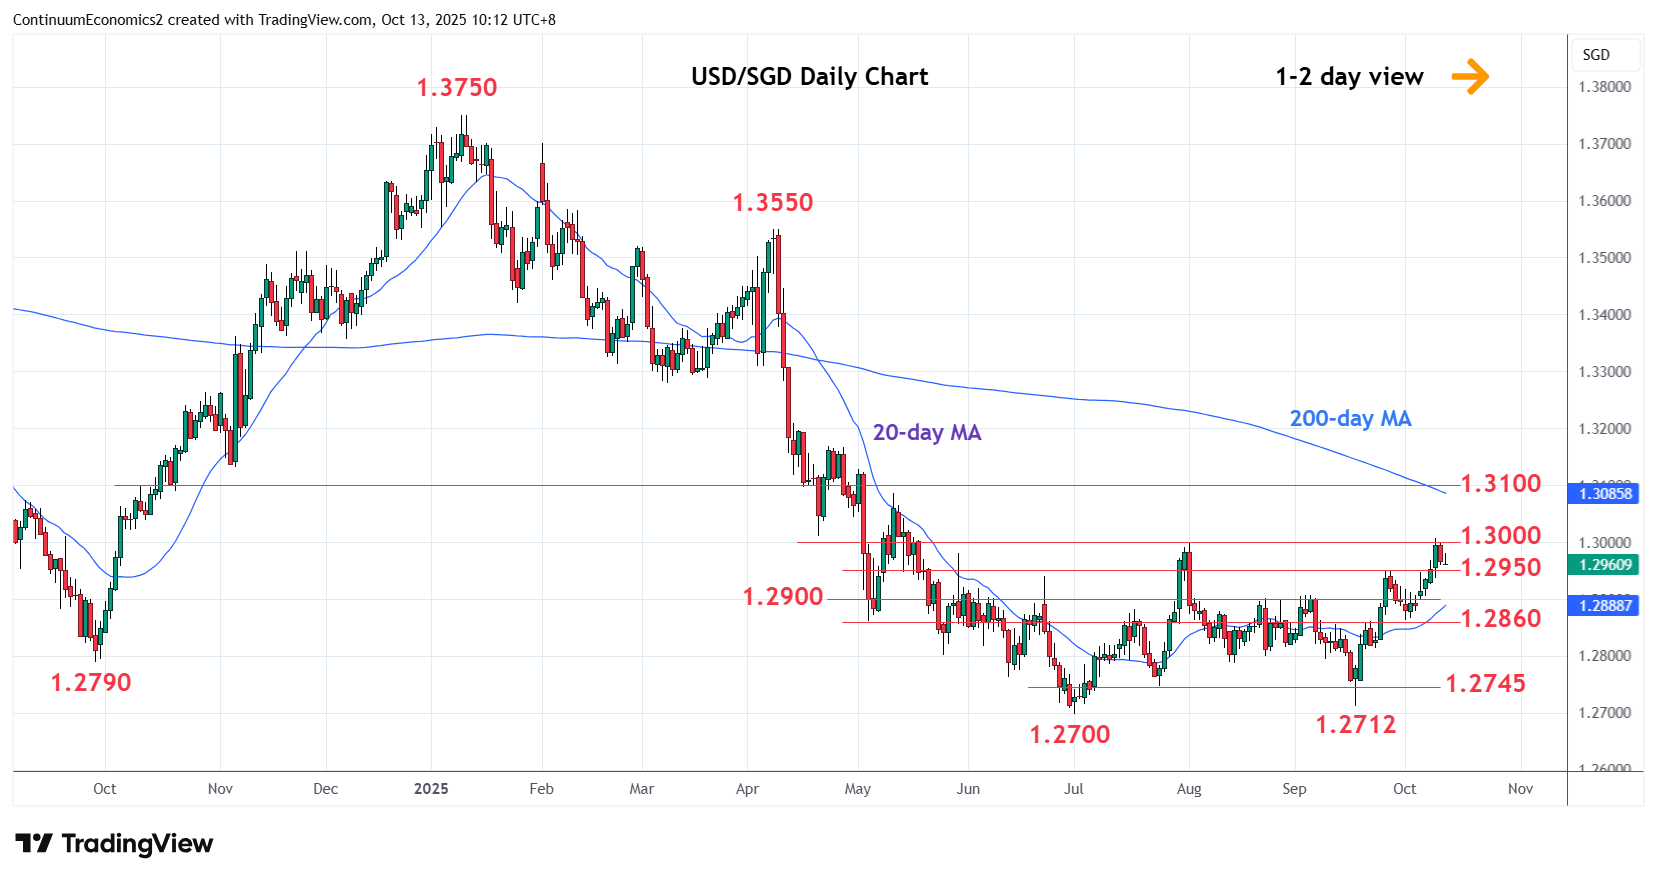
Chart USD/SGD Update: Lower in consolidation from 1.3000/10 resistance
Lower in range from the 1.3000/10 resistance as prices unwind overbought intraday studies
| Level | Comment | Level | Comment | ||||
|---|---|---|---|---|---|---|---|
| R4 | 1.3130 | May high | S1 | 1.2950 | ** | 25 Sep high | |
| R3 | 1.3100 | * | 38.2% Jan/Jul fall | S2 | 1.2900 | ** | congestion |
| R2 | 1.3085 | * | 12 May high | S3 | 1.2860 | * | 22 Sep high, congestion |
| R1 | 1.3000/10 | ** | Aug high, Apr low | S4 | 1.2815/00 | * | congestion |
Asterisk denotes strength of level
02:30 GMT - Lower in range from the 1.3000/10 resistance as prices unwind overbought intraday studies. Daily studies are stretched as well and suggest room for deeper pullback to retrace gains from the 1.2712, September low. Support starts at 1.2950 and break here will open up room to the strong support at the 1.2900 congestion which is expected to underpin. Would take break here to fade the upside pressure and open up room for deeper pullback to support at 1.2860 and the 1.2815/00 area. Break above the 3000/10 resistance will confirm a double bottom at the 1.2712/1.2700 lows and see room for stronger gains to retrace the January/July losses.