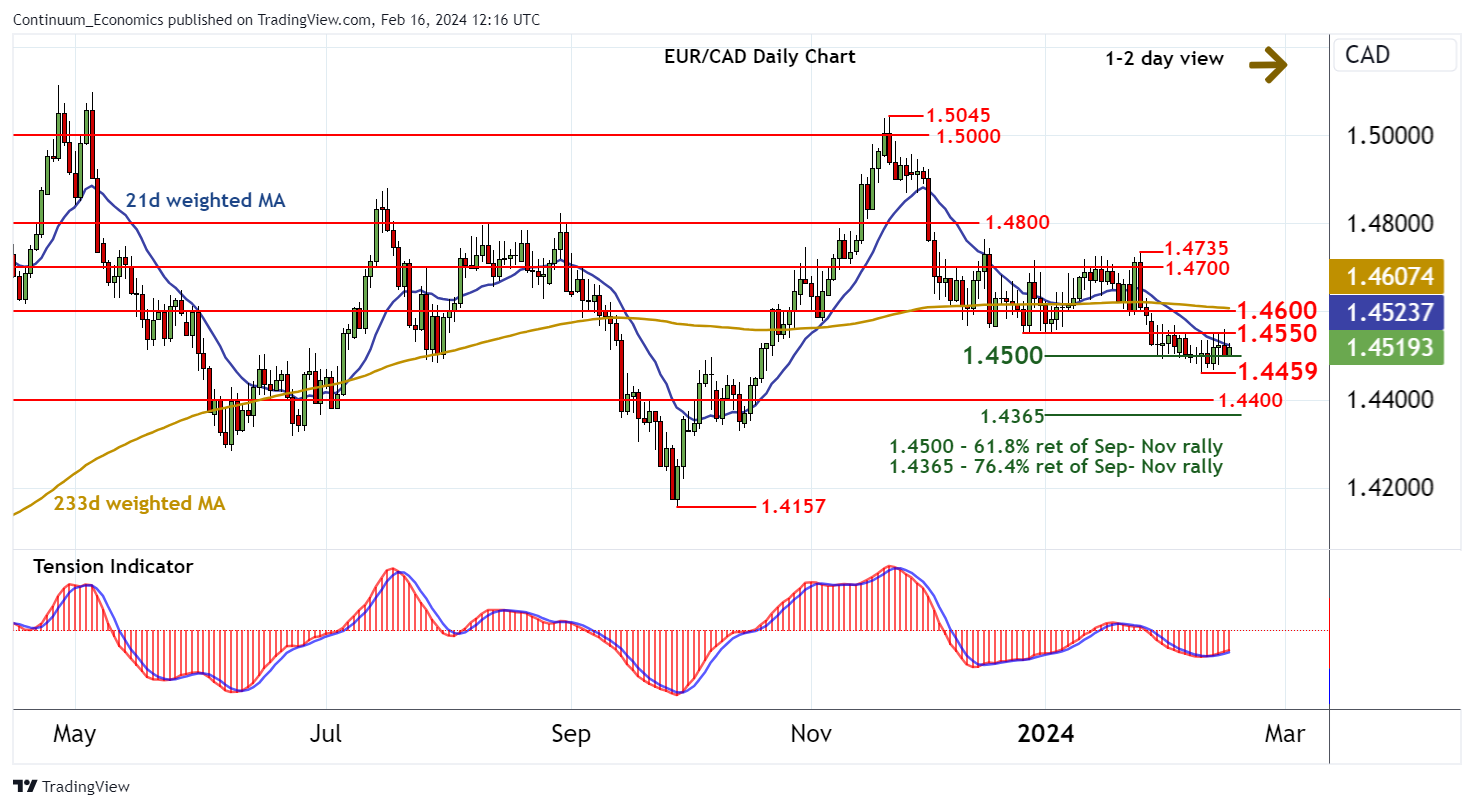
Chart EUR/CAD Update: Extending cautious trade - limited tests higher
The anticipated test of resistance at 1.4550 is giving way to further consolidation

| Levels | Imp | Comment | Levels | Imp | Comment | |||
|---|---|---|---|---|---|---|---|---|
| R4 | 1.4735 | ** | 25 Jan YTD high | S1 | 1.4500 | ** | congestion, 61.8% ret | |
| R3 | 1.4700 | * | congestion | S2 | 1.4459 | * | 9 Feb YTD low | |
| R2 | 1.4600 | * | congestion | S3 | 1.4400 | ** | congestion | |
| R1 | 1.4550 | ** | range lows | S4 | 1.4365 | ** | 76.4% ret of Sep-Nov rally | |
Asterisk denotes strength of level
12:05 GMT - The anticipated test of resistance at 1.4550 is giving way to further consolidation, as overbought intraday studies unwind. Rising daily readings and flattening oversold weekly stochastics are putting focus back on 1.4550, but the negative weekly Tension Indicator and bearish longer-term charts should limit any initial break in fresh selling interest towards congestion resistance at 1.4600. Following corrective trade, lower levels are looked for. However, a close below critical support at the 1.4459 current year low of 9 February is needed to turn sentiment outright negative and extend November losses towards congestion support at 1.4400. Just lower is the 1.4365 Fibonacci retracement, where more significant short-covering/consolidation could develop.