Published: 2026-05-06T04:37:10.000Z
Chart USD/MYR Update: Extend consolidation above 3.9400 low
-
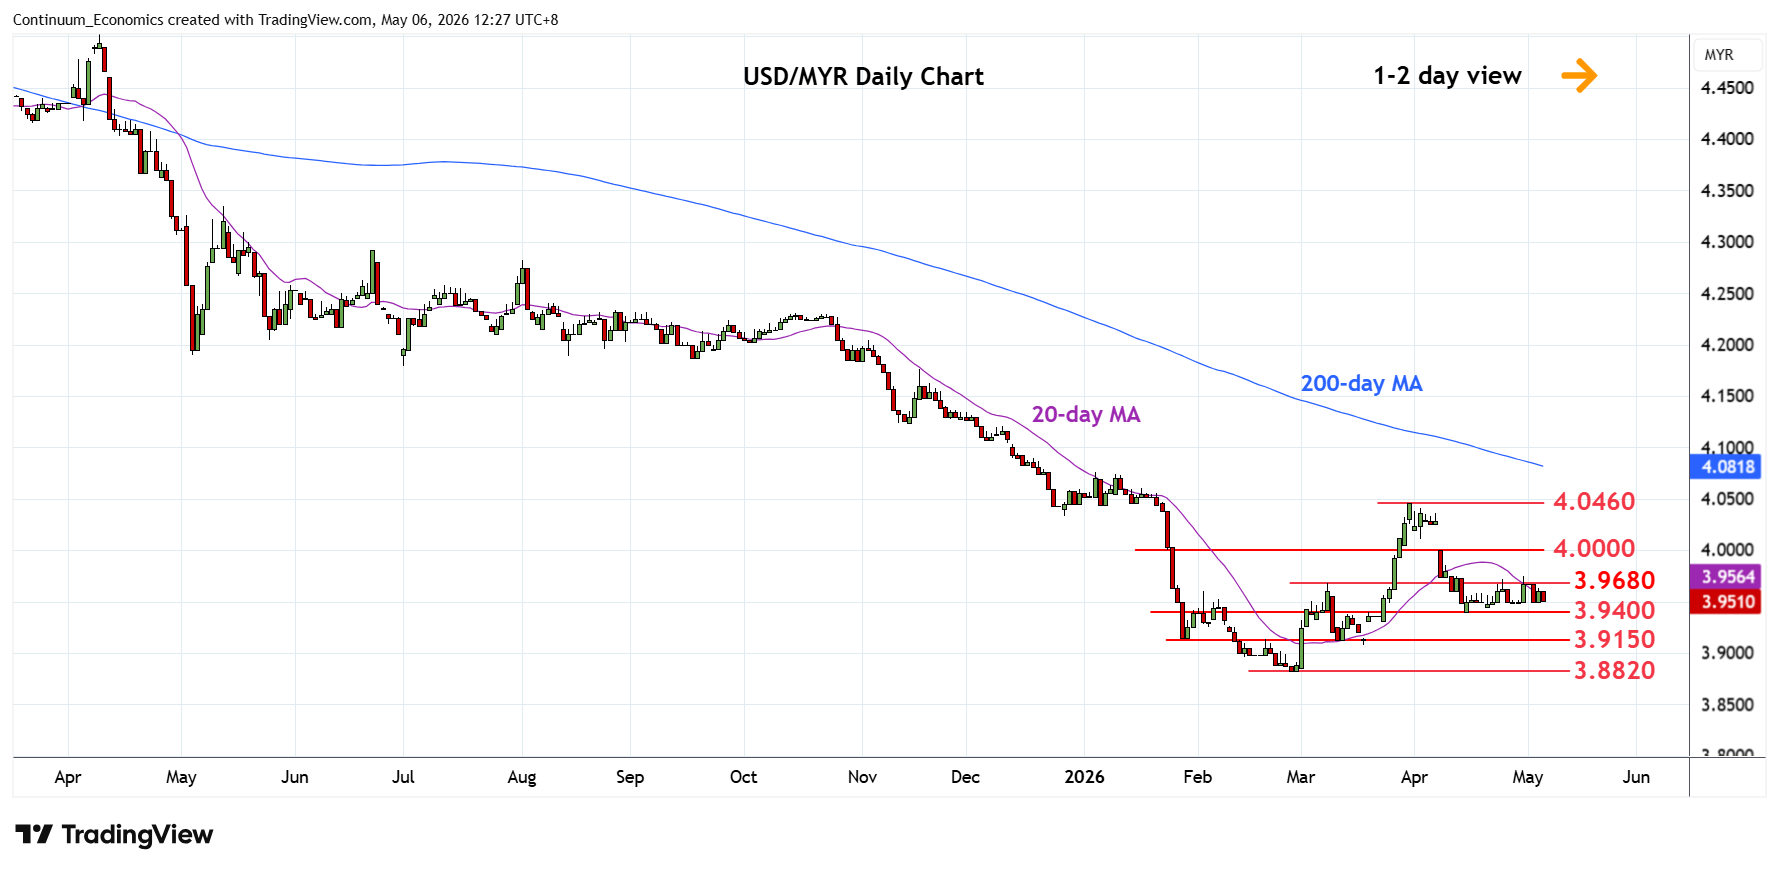
Little change, as prices extend choppy trade above the 3.9400 April low to consolidate losses from the 4.0460 March high
| Levels | Imp | Comment | Levels | Imp | Comment | |||
|---|---|---|---|---|---|---|---|---|
| R4 | 4.0460 | ** | 31 Mar high | S1 | 3.9400 | * | 15 Apr low | |
| R3 | 4.0100 | * | 2 Apr low | S2 | 3.9300 | * | congestion | |
| R2 | 4.0000 | * | congestion | S3 | 3.9150 | * | Jan low, congestion | |
| R1 | 3.9680 | * | 9 Mar high | S4 | 3.8820 | ** | 26 Feb YTD low |
Asterisk denotes strength of level
04:30 GMT - Little change, as prices extend choppy trade above the 3.9400 April low to consolidate losses from the 4.0460 March high. Consolidation expected to give way to renewed selling pressure later and lower will see deeper pullback to retrace gains from the February low. Lower will see room to 3.9150 congestion and 3.9000 level. Below these will expose the 3.8820 February current year low to retest. Meanwhile, resistance at the 3.9680 March high is expected to cap. Clearance will extend corrective bounce but expected to give way to renewed selling pressure later.