Published: 2026-02-19T05:59:12.000Z
Chart USD/CNH Update: Turned up in consolidation from 6.8800 low
1
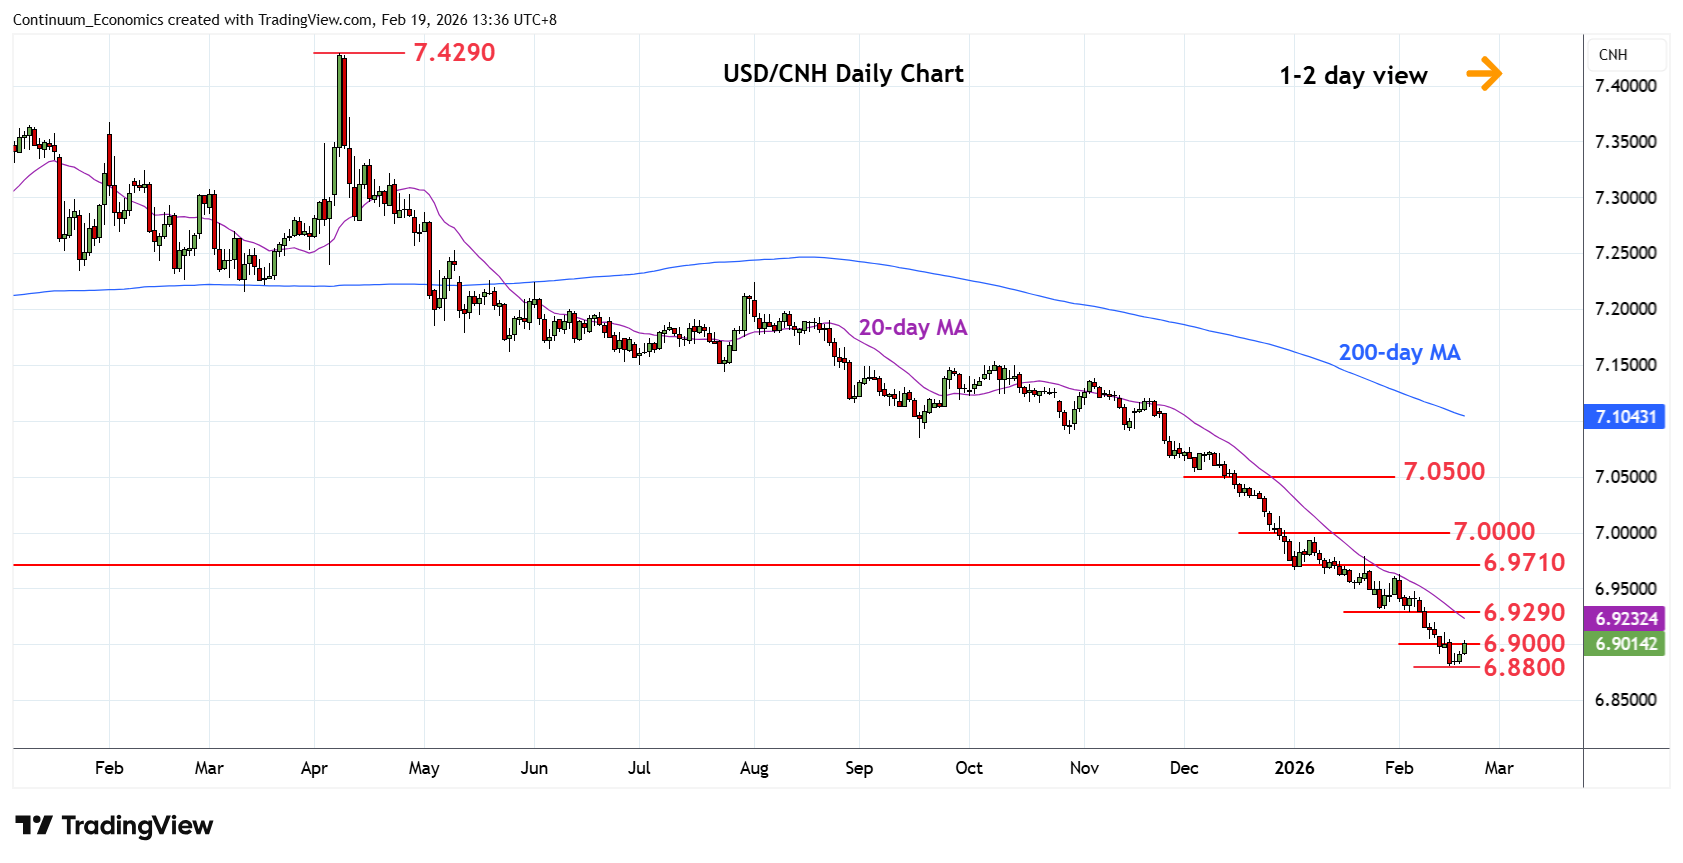
Turned up from the 6.8800 low as prices unwind the oversold daily studies
| Level | Imp | Comment | Level | Imp | Comment | |||
|---|---|---|---|---|---|---|---|---|
| R4 | 6.9710/50 | ** | 2024/2025 year lows | S1 | 6.8800 | ** | 16 Feb YTD low | |
| R3 | 6.9500 | * | congestion | S2 | 6.8700 | * | 76.4% 2023/2025 rally | |
| R2 | 6.9300 | * | Jan low, congestion | S3 | 6.8500 | * | congestion | |
| R1 | 6.9100 | * | 13 Feb high | S4 | 6.8100 | * | Mar 2023 low |
Asterisk denotes strength of level
05:50 GMT - Turned up from the 6.8800 low as prices unwind the oversold daily studies and consolidate sharp losses from the 6.9960, January high. Bounce see resistance at the 6.9100/6.9300 congestion area expected to cap. Clearance here will open up room for strong gains to 6.9500 congestion and strong resistance at 6.9710/6.9750, 2024 and 2025 year lows. Break here will see room for stronger recovery to retrace sharp losses from the 7.4290, April 2025 year high. Meanwhile, support at 6.8800 low now underpin. Below this will further extend losses to support at 6.8100/6.8000.