Chart USD/BRL Update: Balanced above year lows - studies under pressure
Cautious trade beneath 5.4000 has given way to a steady fall
| Levels | Imp | Comment | Levels | Imp | Comment | |||
|---|---|---|---|---|---|---|---|---|
| R4 | 5.4500 | * | break level | S1 | 5.2700 | ** | 18 Sep (m) low | |
| R3 | 5.4000 | * | congestion | S2 | 5.2160 | June 2024 low | ||
| R2 | 5.3500 | * | congestion | S3 | 5.2000 | ** | congestion | |
| R1 | 5.3000 | * | congestion | S4 | 5.1500 | * | congestion |
Asterisk denotes strength of level
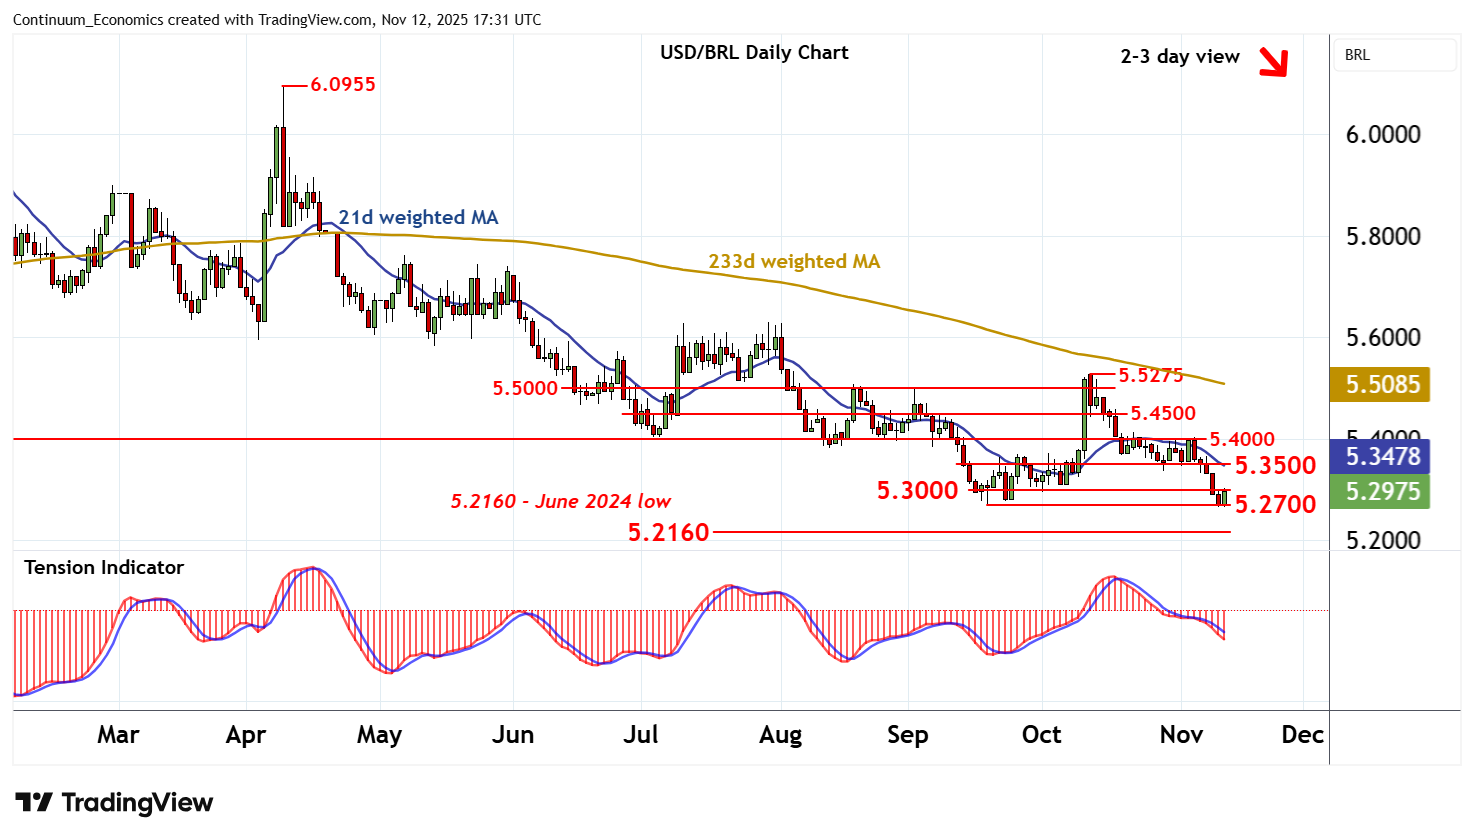
17:20 GMT - Cautious trade beneath 5.4000 has given way to a steady fall, with prices posting a fresh year low just below the 5.2700 monthly low of 18 September, before bouncing back to congestion resistance at 5.3000. Unwinding oversold daily stochastics highlight potential for a test above here. But the bearish daily Tension Indicator and deteriorating weekly charts should limit scope in renewed selling interest beneath further congestion around 5.3500. Following cautious trade, fresh losses are looked for. However, a close below 5.2700 is needed to add weight to sentiment and confirm continuation of December 2024 losses, initially to the 5.2160 low of June 2024.