Published: 2026-03-03T05:20:10.000Z
Chart USD/IDR Updates: Extend consolidation within the January range
3
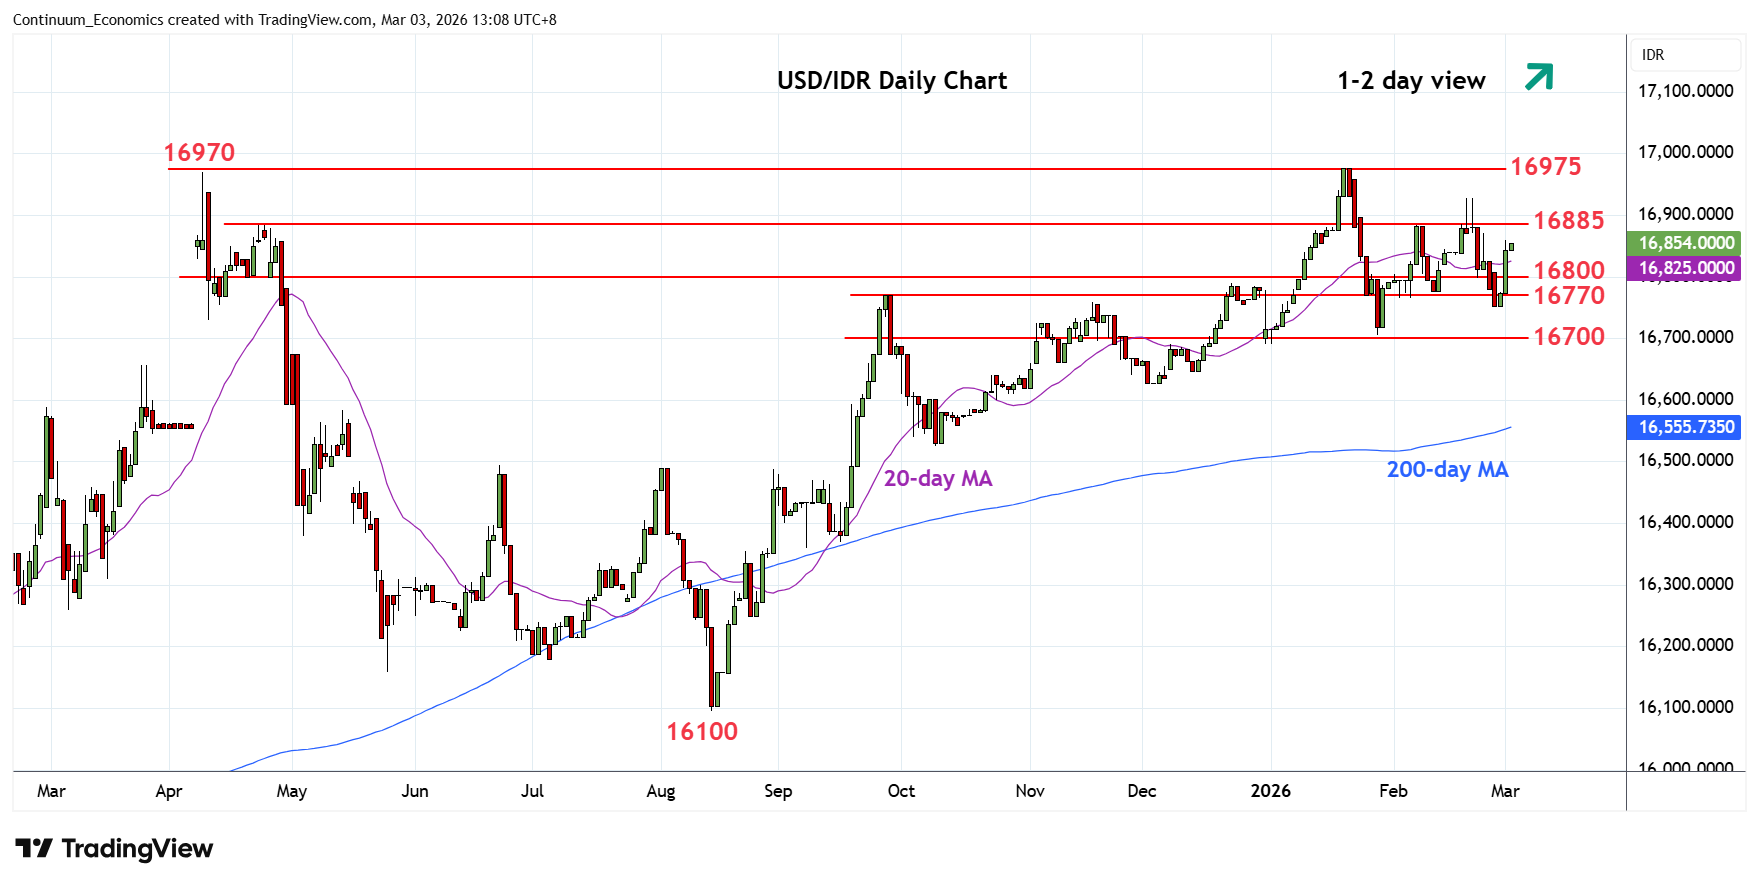
Extending bounce from the 16755 low as prices consolidate within the 16975/16705, January range
| Levels | Imp | Comment | Levels | Imp | Comment | |||
|---|---|---|---|---|---|---|---|---|
| R4 | 16975 | ** | 20 Jan all-time high | S1 | 16755 | * | 26 Feb low | |
| R3 | 16930 | ** | 19 Feb high | S2 | 16705 | ** | 28 Jan YTD low | |
| R2 | 16885 | * | 6 Feb high | S3 | 16625 | * | Dec low | |
| R1 | 16850 | congestion | S4 | 16600 | * | congestion |
Asterisk denotes strength of level
05:15 GMT - Extending bounce from the 16755 low as prices consolidate within the 16975/16705, January range. Daily studies are tracking higher to unwind oversold readings and regaining the 16800 level see room for retest of resistance at 16885 and the 16930 high. Break of these will return focus to the 16975, January current year high. Meanwhile, support at 16755 low should underpin. Would take break of the latter to expose the critical support at 16705 low to retest and see room for deeper correction of gains from the August low.