Published: 2026-02-23T02:46:23.000Z
Chart USD/SGD Update: Extend rejection from 1.2700 resistance
1
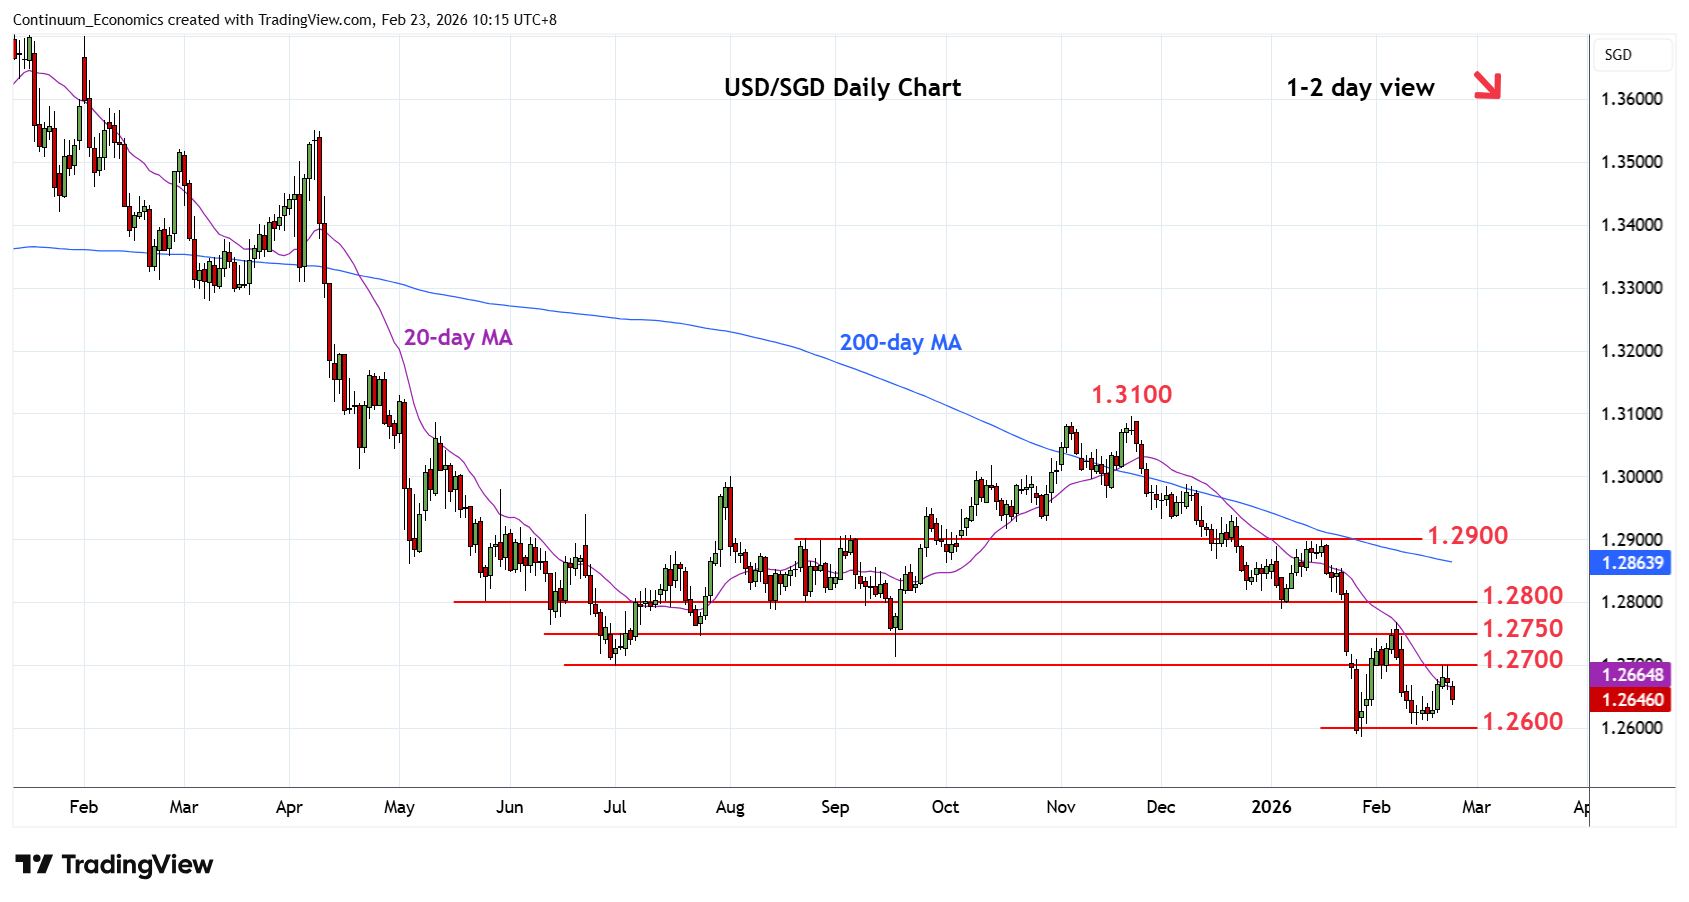
Under pressure as prices rotates lower from test of resistance at the 1.2700 congestion
| Level | Comment | Level | Comment | ||||
|---|---|---|---|---|---|---|---|
| R4 | 1.2780 | ** | congestion | S1 | 1.2600 | * | congestion |
| R3 | 1.2780 | * | 38.2% Nov/Jan fall | S2 | 1.2586 | ** | 28 Jan YTD low |
| R2 | 1.2768 | ** | 6 Feb high | S3 | 1.2550 | * | congestion |
| R1 | 1.2700 | * | congestion | S4 | 1.2500 | * | congestion |
Asterisk denotes strength of level
02:40 GMT - Under pressure as prices rotates lower from test of resistance at the 1.2700 congestion. Return below 1.2650 congestion expose support at the 1.2600/1.2586 congestion and January current year low to retest. Break here will extend the broader losses from the 2020 year high and see extension to the 1.2550/1.2500 congestion area. Meanwhile, resistance at the 1.2700 level now expected to cap. Break here is needed to ease the downside pressure and see room for stronger corrective gains to strong resistance at the 1.2768, 6 February high and the 1.2780/1.2800 area.