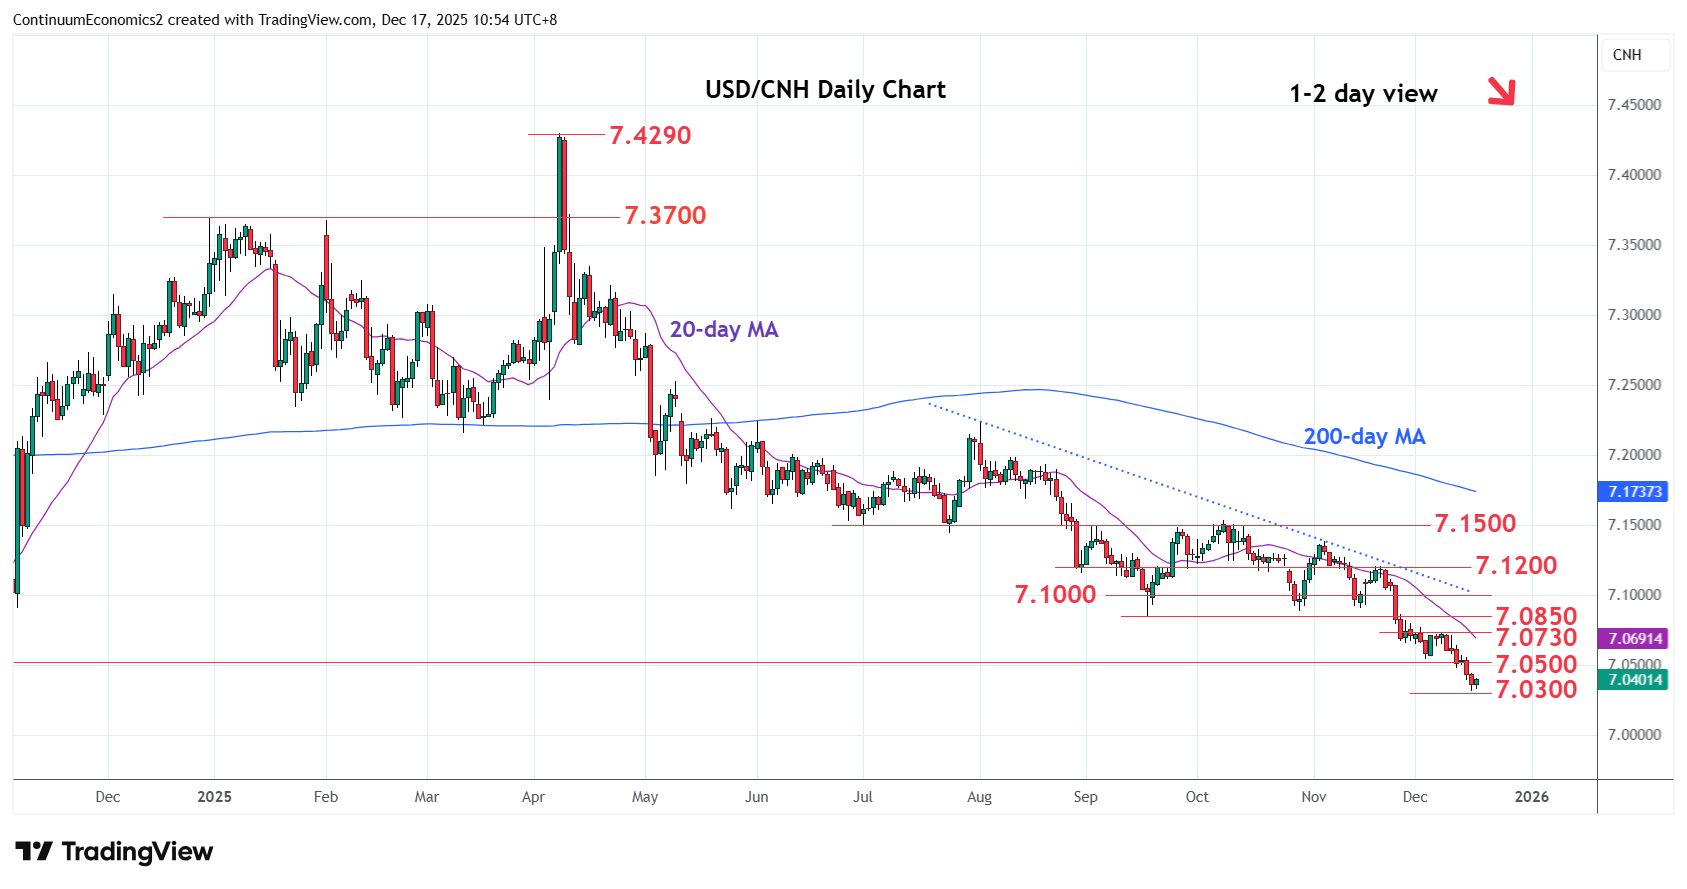
Chart USD/CNH Update: Higher in consolidation from 7.0310 low
Edged up in range from fresh year low at 7.0310 as prices unwind oversold intraday studies
| Level | Imp | Comment | Level | Imp | Comment | |||
|---|---|---|---|---|---|---|---|---|
| R4 | 7.1000 | * | congestion | S1 | 7.0310 | ** | 16 Dec YTD low | |
| R3 | 7.0850 | ** | congestion, Sep low | S2 | 7.0000 | ** | figure | |
| R2 | 7.0730 | * | 8 Dec high | S3 | 6.9710 | ** | Sep 2024 year low | |
| R1 | 7.0500/40 | * | congestion, 3 Dec low | S4 | 6.9500 | * | congestion |
Asterisk denotes strength of level
03:00 GMT - Edged up in range from fresh year low at 7.0310 as prices unwind oversold intraday studies. Daily chart are stretched as well and suggest scope for bounce to correct recent steep drop from the November high. Bounce see resistance starting at the 7.0500/7.0540, congestion and 3rd Decmeber low. Regaining this will see room for stronger corrective bounce to resistance at 7.0730 congestion and the 7.0850/7.1000, September low and congestion area. Correction is expected to give way to renewed selling pressure later to further extend losses from the April YTD high. Lower will see potential to the 7.0000 figure but focus will turn to the 6.9710, September 2024 year low.