Published: 2026-02-06T05:00:28.000Z
Chart USD/INR Update: Consoldating, room for lower later
2
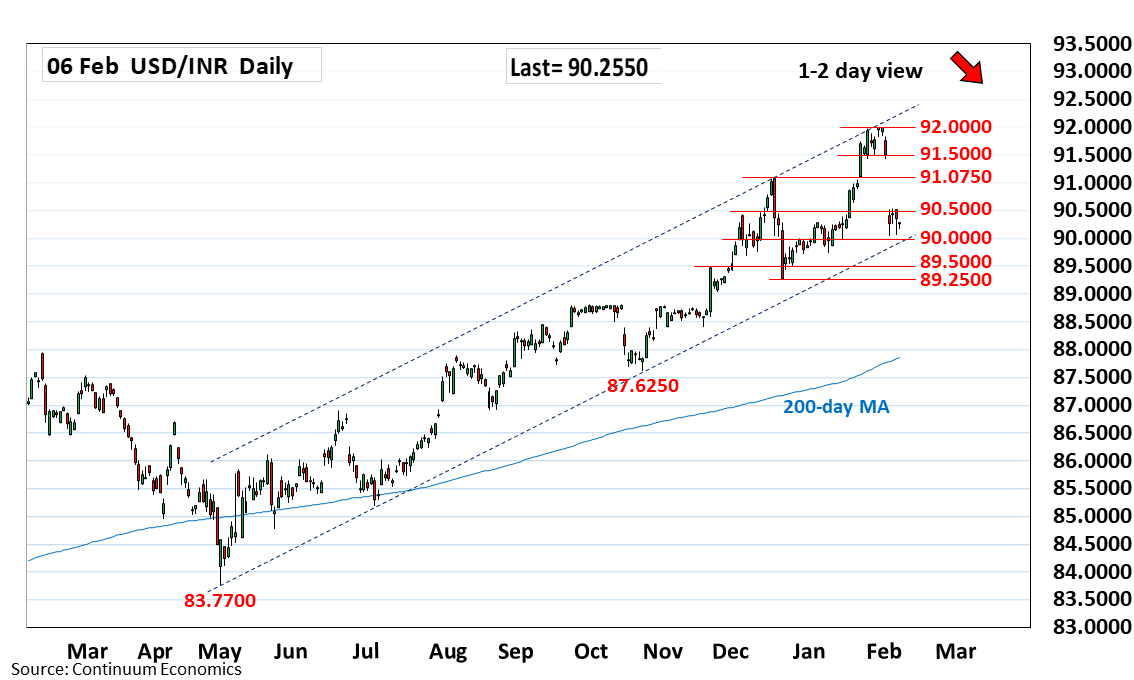
Sideways in range above the 90.2600 low as prices consolidate sharp drop from the 91.9875 all-time high
| Level | Comment | Level | Comment | |||||
|---|---|---|---|---|---|---|---|---|
| R4 | 91.9875 | ** | 30 Jan all-time high | S1 | 90.0000 | * | figure, congestion | |
| R3 | 91.5000 | * | congestion | S2 | 89.7400 | * | Jan low | |
| R2 | 91.0750 | ** | Dec high | S3 | 89.5000 | * | congestion | |
| R1 | 90.5300 | * | 4 Feb high | S4 | 89.2500 | ** | Dec low |
Asterisk denotes strength of level
05:00 GMT - Sideways in range above the 90.2600 low as prices consolidate sharp drop from the 91.9875 all-time high. Bounce see prices unwinding oversold intraday studies but negative daily and weekly studies suggest consolidation giving way to fresh selling pressure later. Break of the 90.2600 low and the 90.0000 figure will see room for retest of 89.7400, January low. Below the latter will return focus to the 89.5000 congestion and 89.2500 December low. Meanwhile, resistance at the 91.0000/91.0750 area is expected to cap and sustain losses from the January high.