Published: 2026-02-23T03:08:02.000Z
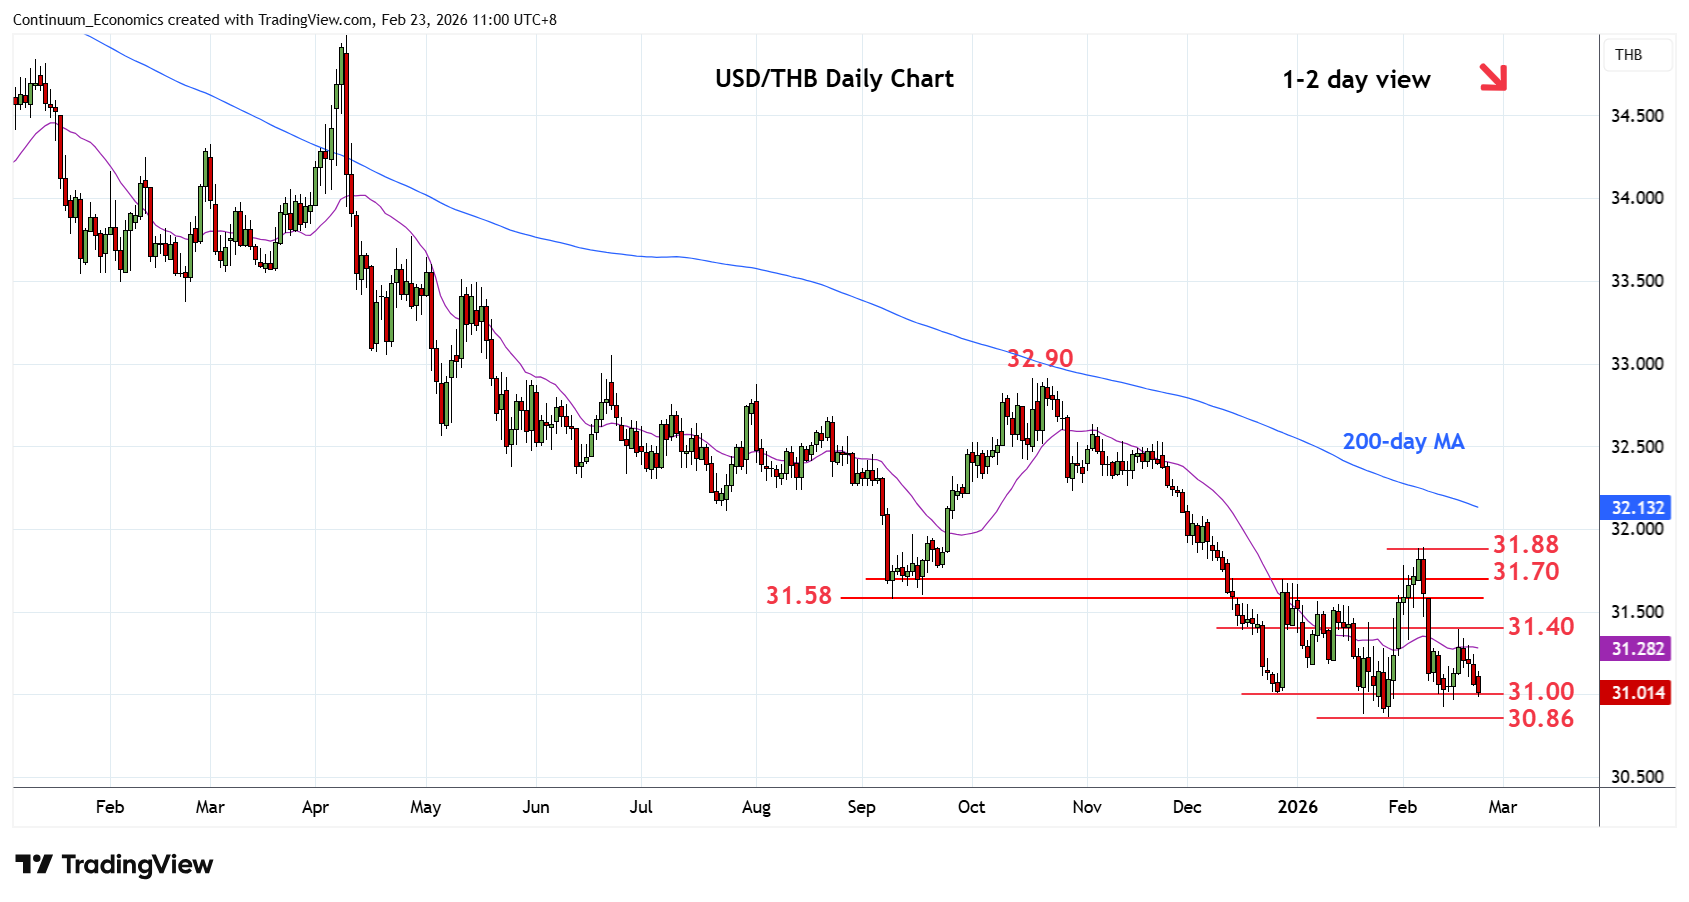
Chart USD/THB Update: Weighing on 31.00 level
-
Settled back to retest the 31.00 level following rejection from test of the 31.40 resistance
| Level | Comment | Level | Comment | |||||
|---|---|---|---|---|---|---|---|---|
| R4 | 31.80 | * | congestion | S1 | 31.00 | * | Dec low | |
| R3 | 31.70 | * | congestion | S2 | 30.86 | ** | 28 Jan YD low | |
| R2 | 31.58/60 | ** | Sep low, congestion | S3 | 30.80 | * | congestion | |
| R1 | 31.40 | * | congestion | S4 | 30.65 | * | 18 Mar 2021 low |
Asterisk denotes strength of level
03:00 GMT - Settled back to retest the 31.00 level following rejection from test of the 31.40 resistance. Risk is seen for break to expose the 28 January current year low at 30.86 to retest. Below this will further extend the broader losses from the October 2022 high and see room to support at the 30.80 congestion. Lower still, will see room to support at the 30.65/30.50 area. Meanwhile, resistance at the 31.20/31.40 congestion are now expected to cap and sustain losses from the 31.88, 6 February swing high.