Published: 2026-01-15T02:10:45.000Z
Chart USD/SGD Update: Pressuring resistance at 1.2900
-
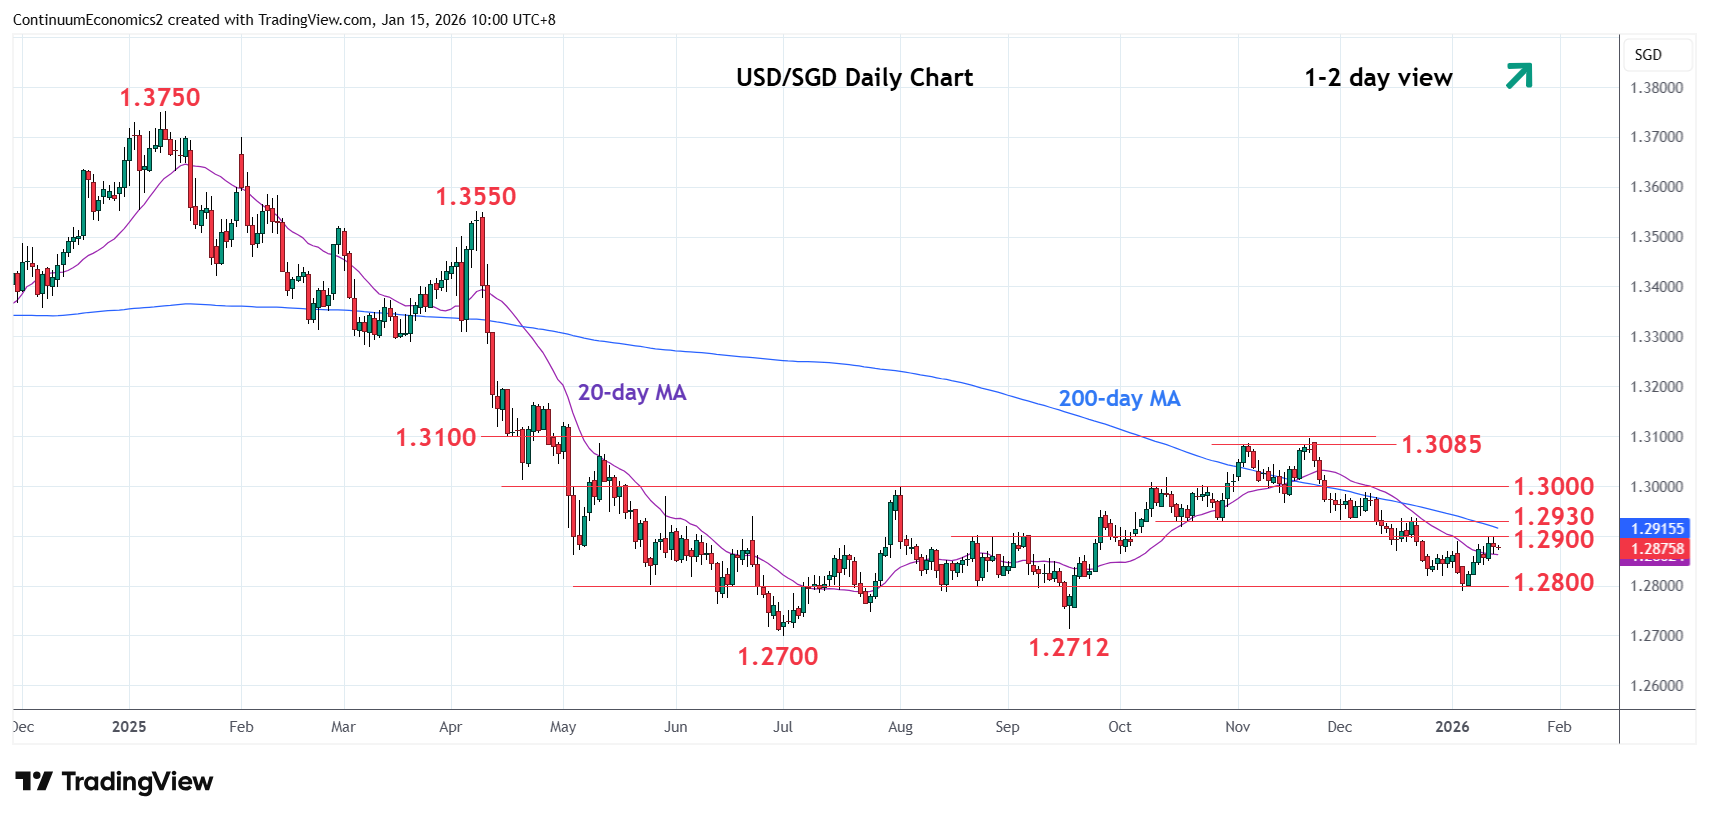
Bounce from support at the 1.2800/1.2790 area has seen gains to pressure resistance at 1.2900
| Level | Comment | Level | Comment | ||||
|---|---|---|---|---|---|---|---|
| R4 | 1.3085/100 | ** | 12 May high, congestion | S1 | 1.2800 | * | congestion |
| R3 | 1.2980/00 | * | congestion, Aug high | S2 | 1.2750 | * | congestion |
| R2 | 1.2930 | ** | congestion | S3 | 1.2712/00 | ** | Sep, Jul 2025 year lows |
| R1 | 1.2900 | * | congestion | S4 | 1.2650 | * | congestion |
Asterisk denotes strength of level
02:10 GMT - Bounce from support at the 1.2800/1.2790 area has seen gains to pressure resistance at 1.2900. Clearance here will open up room for stronger gains to retrace losses from the 1.3100 November high to strong resistance at 1.2930 congestion which is expected to cap. Break here, if seen, will open up room for stronger gains to the 1.2980/1.3000 resistance. Corrective gains are expected to give way to fresh selling pressure later to retest support at the 1.2850/00 area. Below this will open up room for deeper pullback to 1.2750 congestion but focus will return to the 1.2712/1.2700, September/July lows.