Published: 2026-01-06T02:54:30.000Z
Chart USD/THB Update: Under pressure from 31.70 bounce high
1
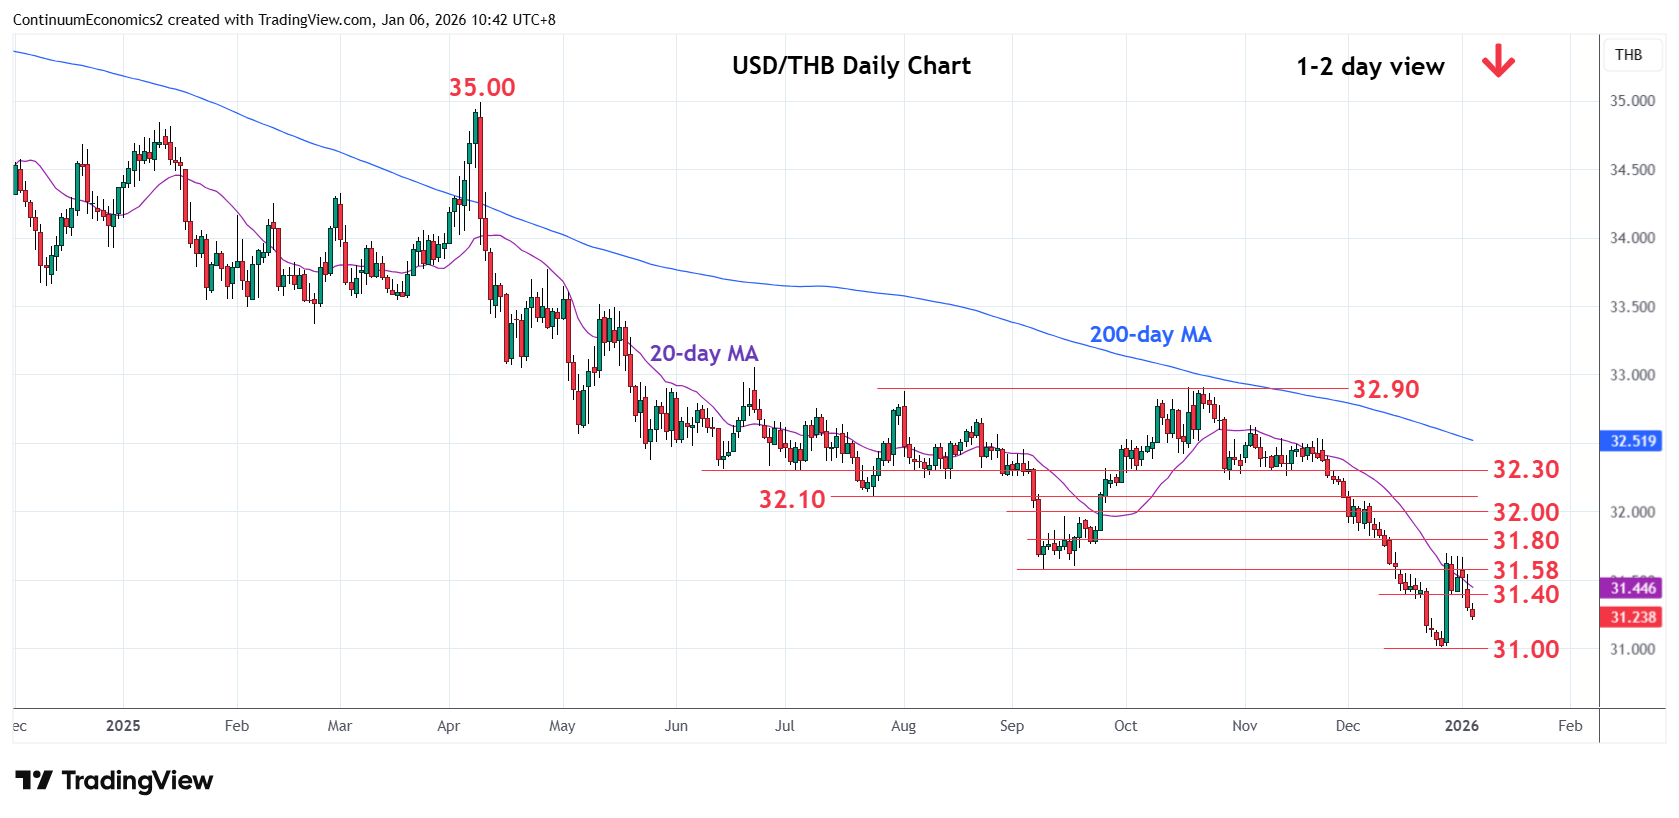
Under pressure as prices turned down from 31.70 bounce high to retrace gains from the 31.00 low
| Level | Comment | Level | Comment | |||||
|---|---|---|---|---|---|---|---|---|
| R4 | 31.80 | * | congestion | S1 | 31.20 | congestion | ||
| R3 | 31.70 | ** | 29 Dec high | S2 | 31.00 | ** | 26 Dec 2025 year low | |
| R2 | 31.58 | * | Sep low | S3 | 30.80 | * | Jun 2020 low | |
| R1 | 31.40 | * | congestion | S4 | 30.60 | * | congestion |
Asterisk denotes strength of level
02:45 GMT - Under pressure as prices turned down from 31.70 bounce high to retrace gains from the 31.00 low. Daily studies have turn down to unwind overbought readings and threaten pullback to retest tge 31.00 low. Break here will extend the broader losses from the September 2022 year high and see room to support at the 30.80/30.60 congstion area. Meanwhile, resistance is lowered to the 31.40/31.58 congestion area which is now expected to cap and sustain pullback from the 31.70, late-December swing high.