Published: 2026-05-11T06:19:39.000Z
Chart USD/IDR Updates: Poised for retest of 17437 historic high
2
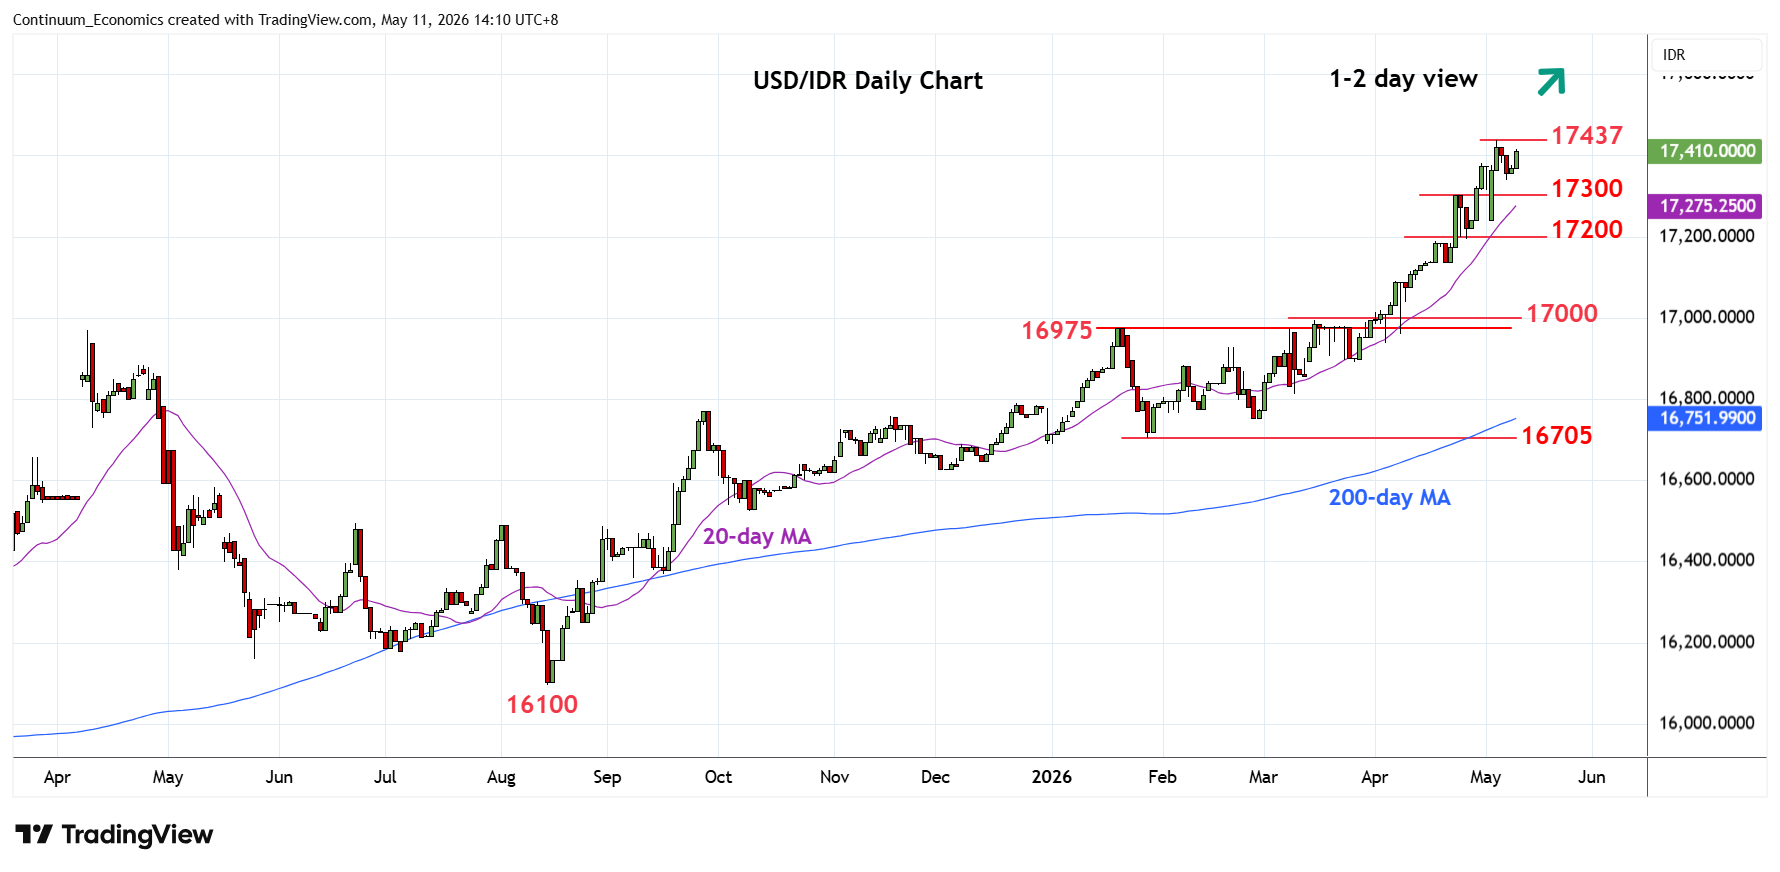
Bounce from the 17340 Thursday's low see prices poised for retest of the 17437 historic high
| Levels | Imp | Comment | Levels | Imp | Comment | |||
|---|---|---|---|---|---|---|---|---|
| R4 | 18000 | figure | S1 | 17300 | * | 23 Apr high | ||
| R3 | 17600 | projection | S2 | 17240/200 | * | 4 May low, congestion | ||
| R2 | 17500 | projection | S3 | 17137 | 17 Apr low | |||
| R1 | 17437 | ** | 5 May all-time high | S4 | 17100/090 | ** | congestion, 7 Apr high |
Asterisk denotes strength of level
06:15 GMT - Bounce from the 17340 Thursday's low see prices poised for retest of the 17437 historic high. Break here will see room for extension to the 17500 and 17600 projection targets but overbought daily and weekly studies caution corrective pullback. Support is raised to the 17340/17300 area and see break here needed to open up room for deeper corrective pullback to retrace strong gains from the 16705, January current year low. Break will see room for deeper correction to support at the 17240/17200 area and the 17100 congestion.