Published: 2025-12-12T06:07:28.000Z
Chart USD/MYR Update: Extending losses
1
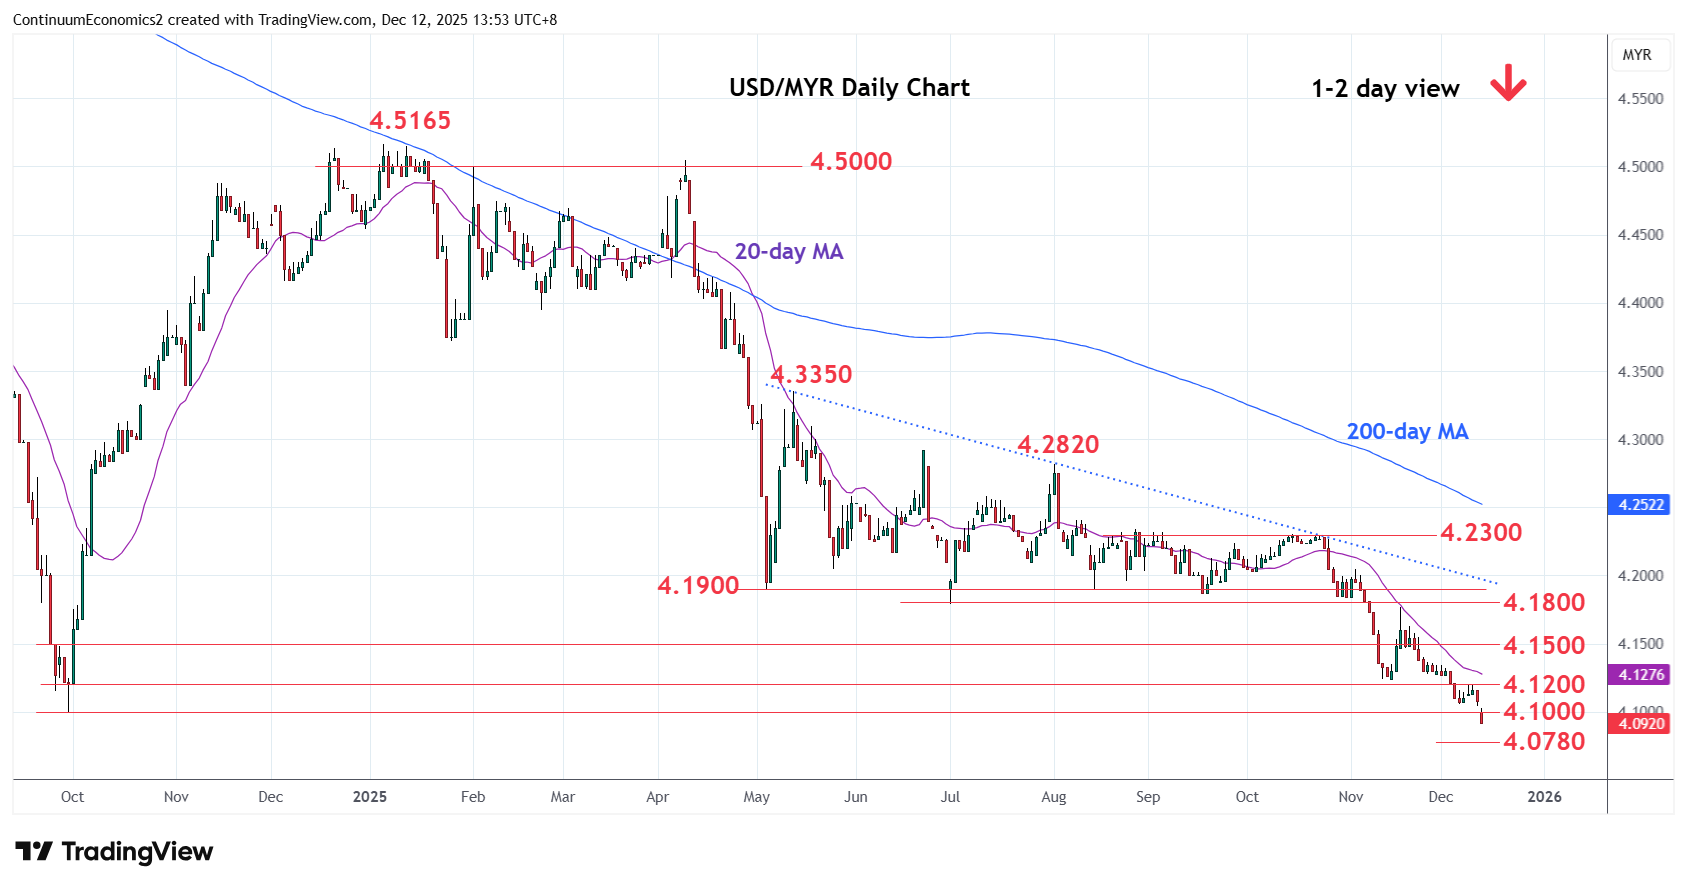
Break of the 4.1060 low has seen follow-through to reach fresh year low below 4.1000 level and 2024 year low
| Levels | Imp | Comment | Levels | Imp | Comment | |||
|---|---|---|---|---|---|---|---|---|
| R4 | 4.1800 | ** | Jul low | S1 | 4.0900 | * | Apr 2021 low | |
| R3 | 4.1470/00 | * | 18 Nov low, congestion | S2 | 4.0800 | * | congestion | |
| R2 | 4.1240 | ** | 14 Nov low | S3 | 4.0780 | * | 76.4% 2018/2024 rally | |
| R1 | 4.1060 | * | 5 Dec low | S4 | 4.0650 | Nov 2020 low |
Asterisk denotes strength of level
06:00 GMT - Break of the 4.1060 low has seen follow-through to reach fresh year low below 4.1000 level and 2024 year low. Nearby see room for extension to support at the 4.0900/4.0800 congestion area then the 4.0780, 76.4% Fibonacci level. Lower still, will see extension to 4.0650 support then the 4.0500 congestion. Meanwhile, resistance is lowered to the 4.1060 low of last week and extending to 4.1240 November low which is expected to cap and sustain losses from the January 2024 year high.