Published: 2026-04-13T05:59:15.000Z
Chart USD/INR Update: Extending bounce from 92.4050 low
-
Sharply higher above the 93.0000 level following bounce from the 92.4050 low of last week
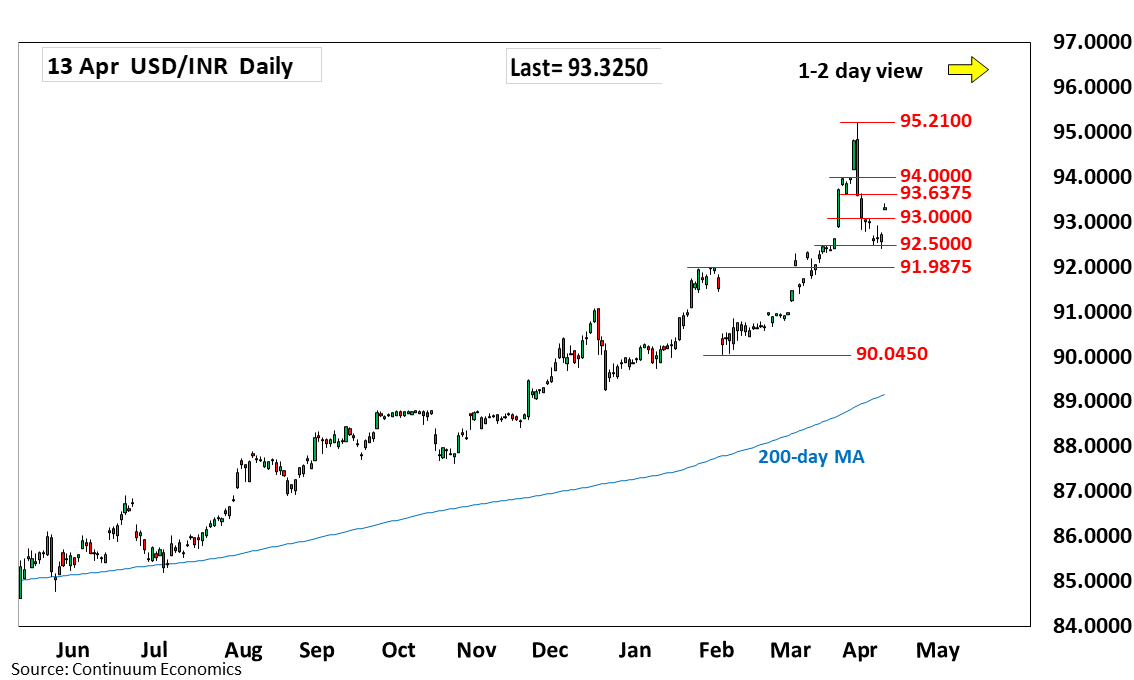
| Level | Comment | Level | Comment | |||||
|---|---|---|---|---|---|---|---|---|
| R4 | 95.2100 | ** | 30 Mar all-time high | S1 | 93.0000 | * | congestion | |
| R3 | 94.8400 | * | 27 Mar high | S2 | 92.4050 | ** | 10 Apr low | |
| R2 | 94.0000 | * | figure | S3 | 91.9875 | ** | Jan high | |
| R1 | 93.6375 | ** | 24 Mar low | S4 | 91.7350 | 10 Mar low |
Asterisk denotes strength of level
06:00 GMT - Sharply higher above the 93.0000 level following bounce from the 92.4050 low of last week as daily studies unwind oversold readings. Higher will see room to strong resistance at the 93.9375 low of 24 March and extending to 94.0000 figure which is expected to cap. Corrective bounce are expected to give way to renewed selling pressure later. Below the 92.4050 low will see room for deeper pullback to extend losses from the 95.2100 all-time high. Lower will see room to strong support at the 92.0000/91.9875 congestion and January high.