Published: 2025-12-05T05:37:48.000Z
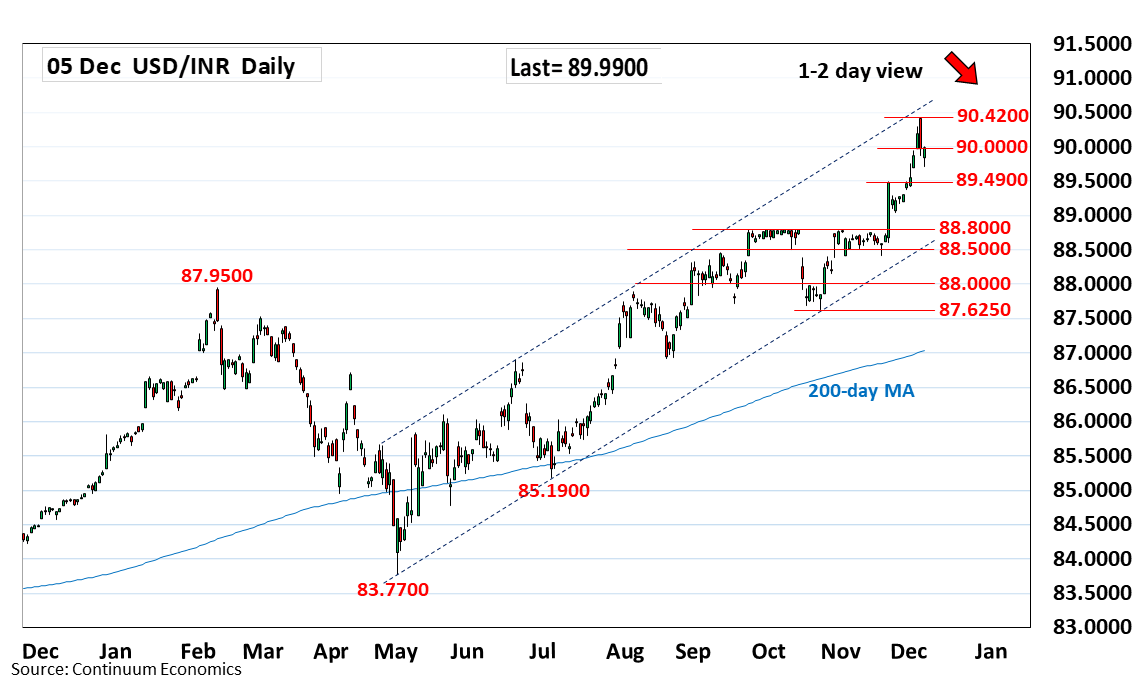
Chart USD/INR Update: Extending reversal from 90.4200 high
1
Extending rejection from the 90.4200 record high
| Level | Comment | Level | Comment | |||||
|---|---|---|---|---|---|---|---|---|
| R4 | 90.7500 | * | projection | S1 | 89.7000 | * | 2 Dec low | |
| R3 | 90.5000 | * | projection | S2 | 89.4900 | ** | Nov high | |
| R2 | 90.4200 | ** | 4 Dec all-time high | S3 | 89.0000 | * | figure | |
| R1 | 90.0000 | * | figure | S4 | 88.8000 | ** | Sep high |
Asterisk denotes strength of level
05:30 GMT - Extending rejection from the 90.4200 record high with the outside range suggesting strong rally from the 87.6250, October low, now being reversed. Below the 90.0000 figure see room for deeper pullback to support at 89.7000 level and 89.4900 November high. Would expect reaction at the latter but a later break cannot be ruled out. Lower will see extension to the 89.0000 figure then strong support at the 88.8000, September high. Meanwhile, resistancce is lowered to the 90.0000 figure which is expected to cap and sustain pullback from 90.4200 high.