Published: 2026-03-27T06:52:00.000Z
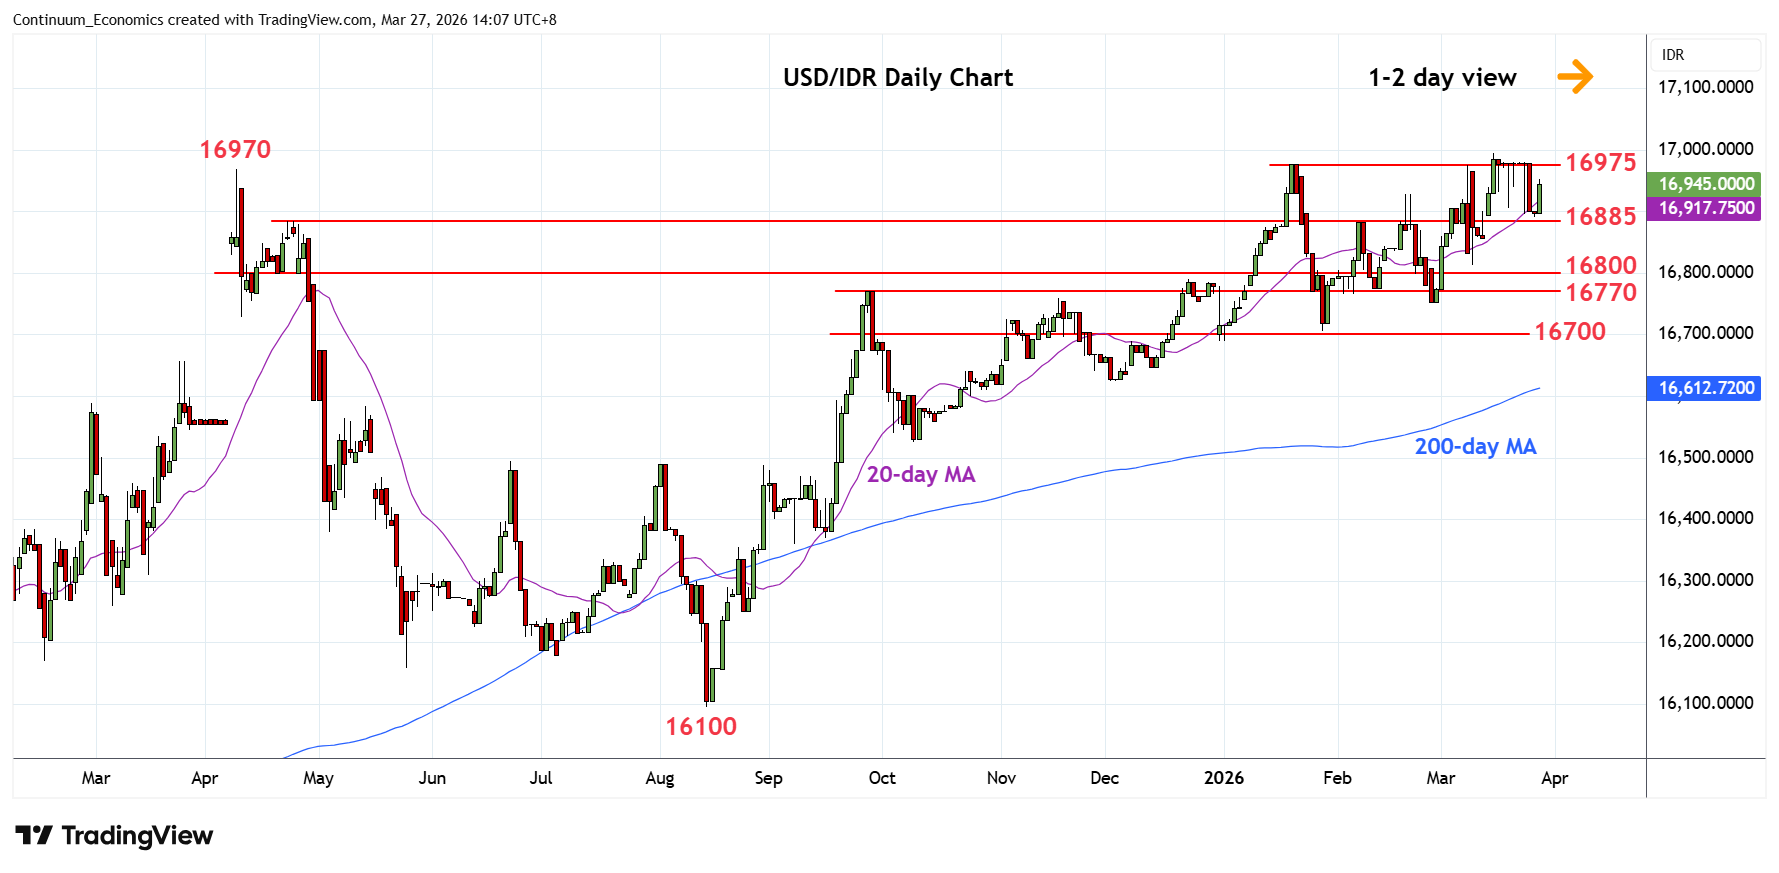
Chart USD/IDR Updates: Consolidating below 16975/16995 highs
2
Turned up in consolidation following bounce from the 16900/16885 support
| Levels | Imp | Comment | Levels | Imp | Comment | |||
|---|---|---|---|---|---|---|---|---|
| R4 | 17600 | projection | S1 | 16885 | * | congestion | ||
| R3 | 17200 | projection | S2 | 16800 | * | congestion | ||
| R2 | 16995 | ** | 16 Mar high | S3 | 16755 | ** | Feb low | |
| R1 | 16975 | * | Jan high | S4 | 16705 | ** | 28 Jan YTD low |
Asterisk denotes strength of level
06:45 GMT - Turned up in consolidation following bounce from the 16900/16885 support. Daily studies remain overbought but break of the latter is needed to open up room for deeper pullback to retrace strong gains from the 16100 August low and see room to support at the 16800 congestion and 16770, September high. Meanwhile, resistance at the 16975/16995 highs are expected to cap. Clearance, if seen, will extend the underlying bull trend and see room for extension to the 17200 and 17600 projection targets.