Published: 2026-04-10T02:55:03.000Z
Chart USD/THB Update: Consolidating test of 31.89 support
1
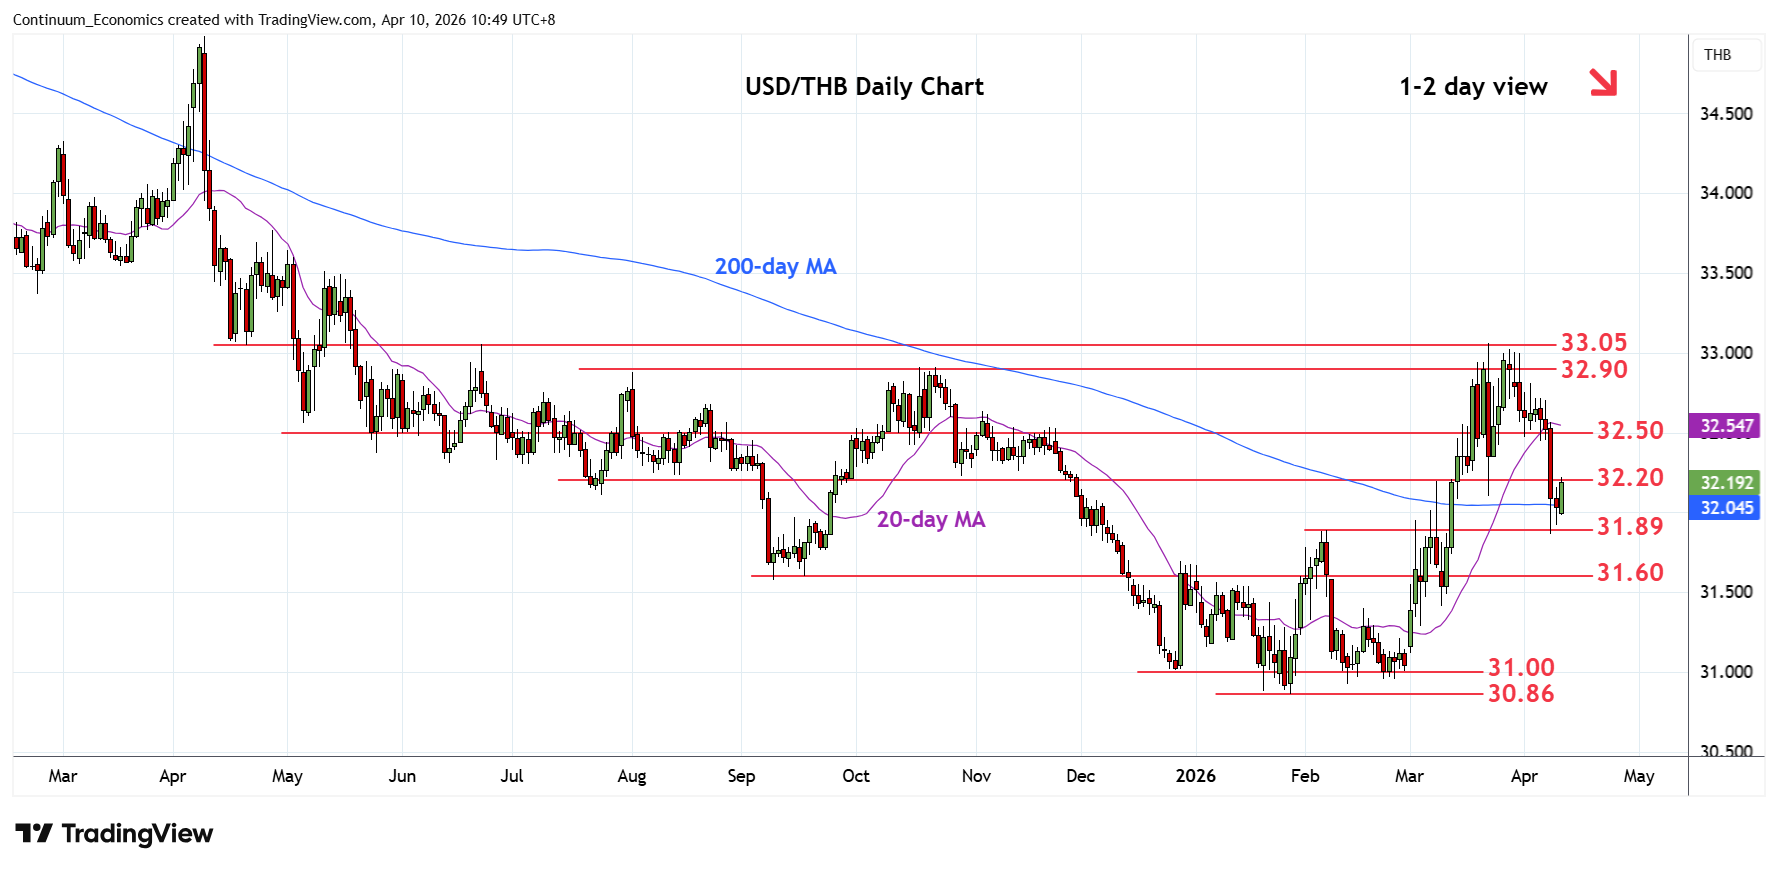
Higher in range from test of the support at 31.89 February high as prices unwind the oversold intraday studies
| Level | Comment | Level | Comment | |||||
|---|---|---|---|---|---|---|---|---|
| R4 | 32.60 | * | congestion | S1 | 32.00 | * | congestion | |
| R3 | 32.50 | ** | congestion | S2 | 31.89 | ** | Feb high | |
| R2 | 32.35 | * | 24 Mar low | S3 | 31.80 | congestion | ||
| R1 | 32.20 | * | congestion | S4 | 31.60/58 | ** | congestion, 2025 yr low |
Asterisk denotes strength of level
02:50 GMT - Higher in range from test of the support at 31.89 February high as prices unwind the oversold intraday studies. Daily chart are stretched as well but negative weekly studies suggest consolidation giving way to renewed selling pressure later. Lower will further extend the March losses to the 31.80 congestion then strong support at the 31.60/58 area. Meanwhile, resistance is lowered to 32.20 congestion. Above here will see room for stronger bounce to strong resistance at 32.35/32.50 area which is expected to cap and sustain losses from the 33.05, March current year high.