Published: 2026-04-16T16:14:25.000Z
Chart USD/BRL Update: Balanced above fresh year low - studies under pressure
4
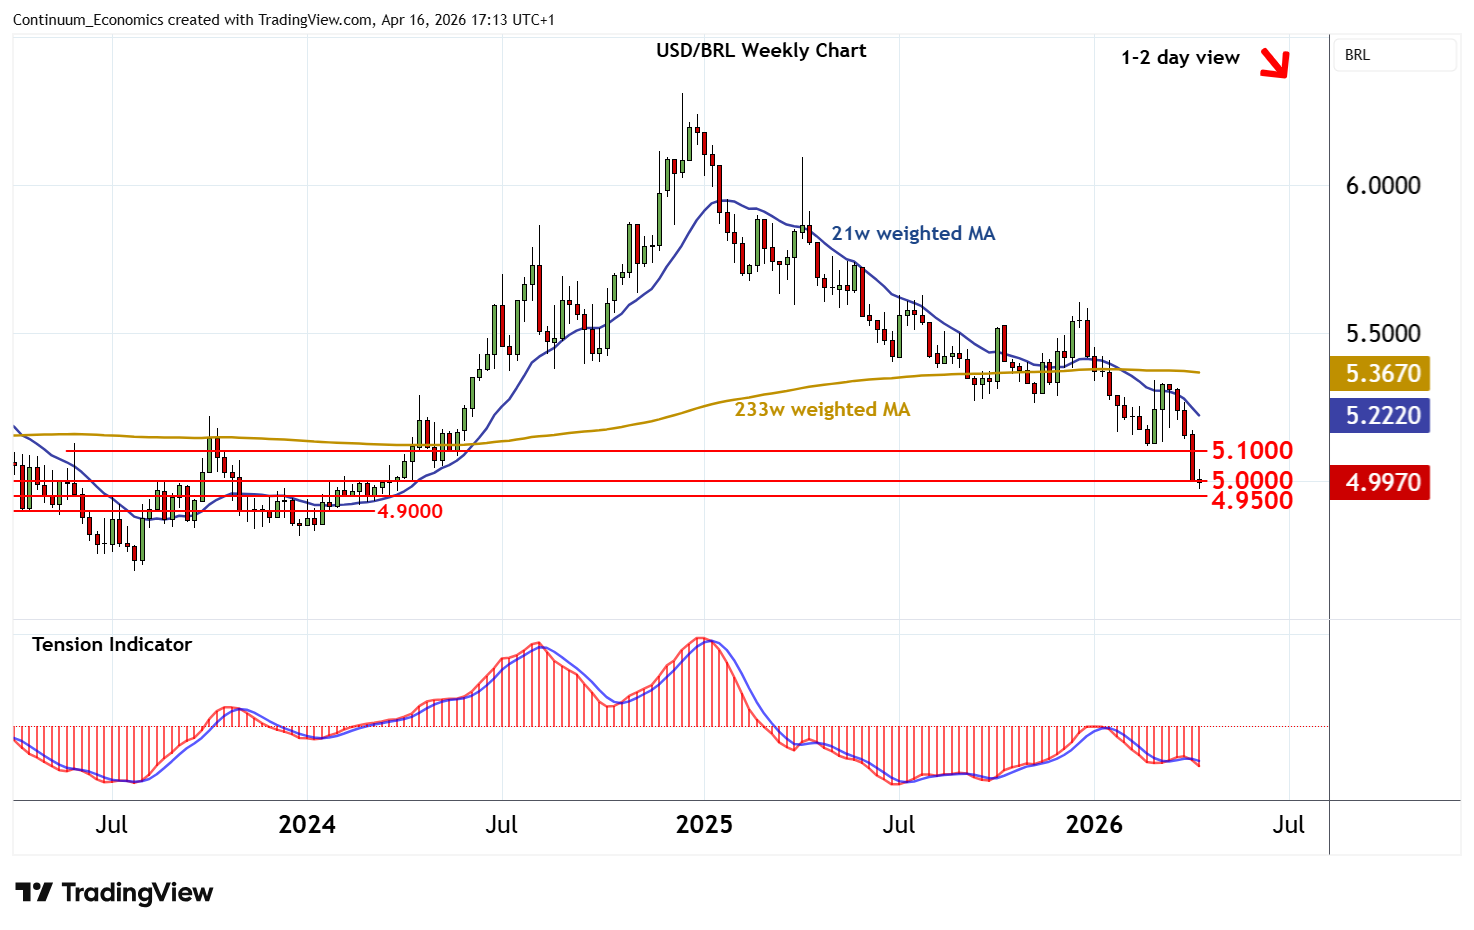
Anticipated losses have tested below 5.0000 to post a fresh year low at 4.9720
| Levels | Imp | Comment | Levels | Imp | Comment | |||
|---|---|---|---|---|---|---|---|---|
| R4 | 5.2000 | * | congestion | S1 | 5.0000 | ** | congestion | |
| R3 | 5.1500 | ** | congestion | S2 | 4.9720 | ** | 14 Apr YTD low | |
| R2 | 5.1170 | ** | 25 Feb (m) low | S3 | 4.9500 | ** | congestion | |
| R1 | 5.1000 | ** | congestion | S4 | 4.9000 | ** | congestion |
Asterisk denotes strength of level
17:00 BST - Anticipated losses have tested below 5.0000 to post a fresh year low at 4.9720, before bouncing back into consolidation around congestion support at 5.0000 as oversold daily stochastics flatten. The daily Tension Indicator remains bearish and broader weekly charts are deteriorating, highlighting room for further losses in the coming sessions. A close below 5.0000 will add weight to sentiment and extend December 2024 losses below 4.9720 towards congestion around 4.9500. Meanwhile, resistance is up to congestion around 5.1000 and should prove difficult to reach in any immediate corrective bounce.