Published: 2025-10-14T04:34:02.000Z
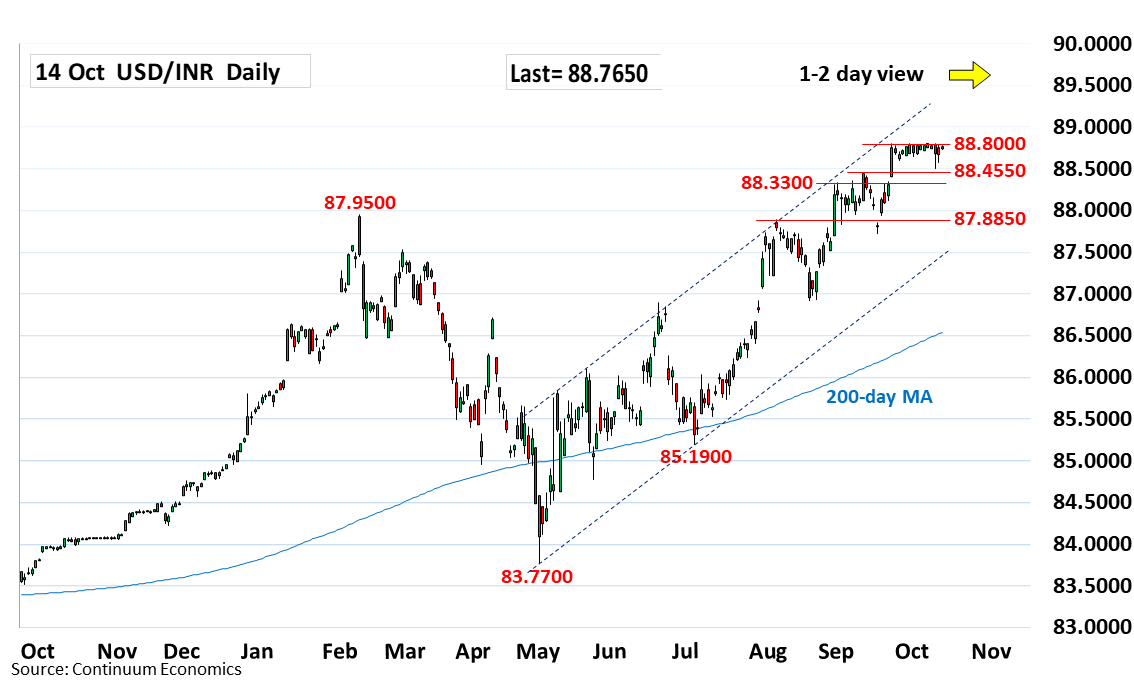
Chart USD/INR Update: Limited pullback from the 88.8000 high
-
Still limited on pullback from the 88.8000 all-time but bias rotating lower and threatens pullback to retest the 88.5000 low
| Level | Comment | Level | Comment | |||||
|---|---|---|---|---|---|---|---|---|
| R4 | 91.5000 | * | projection | S1 | 88.4450 | ** | 11 Sep high | |
| R3 | 90.0000 | ** | psychological | S2 | 88.3300 | * | 1 Sep high | |
| R2 | 89.0000 | * | figure | S3 | 88.0000 | * | congestion | |
| R1 | 88.8000 | ** | 30 Sep all-time high | S4 | 87.8850 | ** | 5 Aug high |
Asterisk denotes strength of level
04:30 GMT - Still limited on pullback from the 88.8000 all-time but bias rotating lower and threatens pullback to retest the 88.5000 low. Below this will turn focus to the strong support at the 88.4450/88.3300, September highs. Would take break here to fade the upside pressure and see deeper pullback to retrace strong gains from the 85.1900, July low. Break above the 88.8000 high will further extend gains within the bull channel from the 83.7700 May low and see room to the 89.0000 figure then the 90.0000 psychological level.