Published: 2025-12-19T05:21:23.000Z
Chart USD/MYR Update: Still heavy, but stretched
1
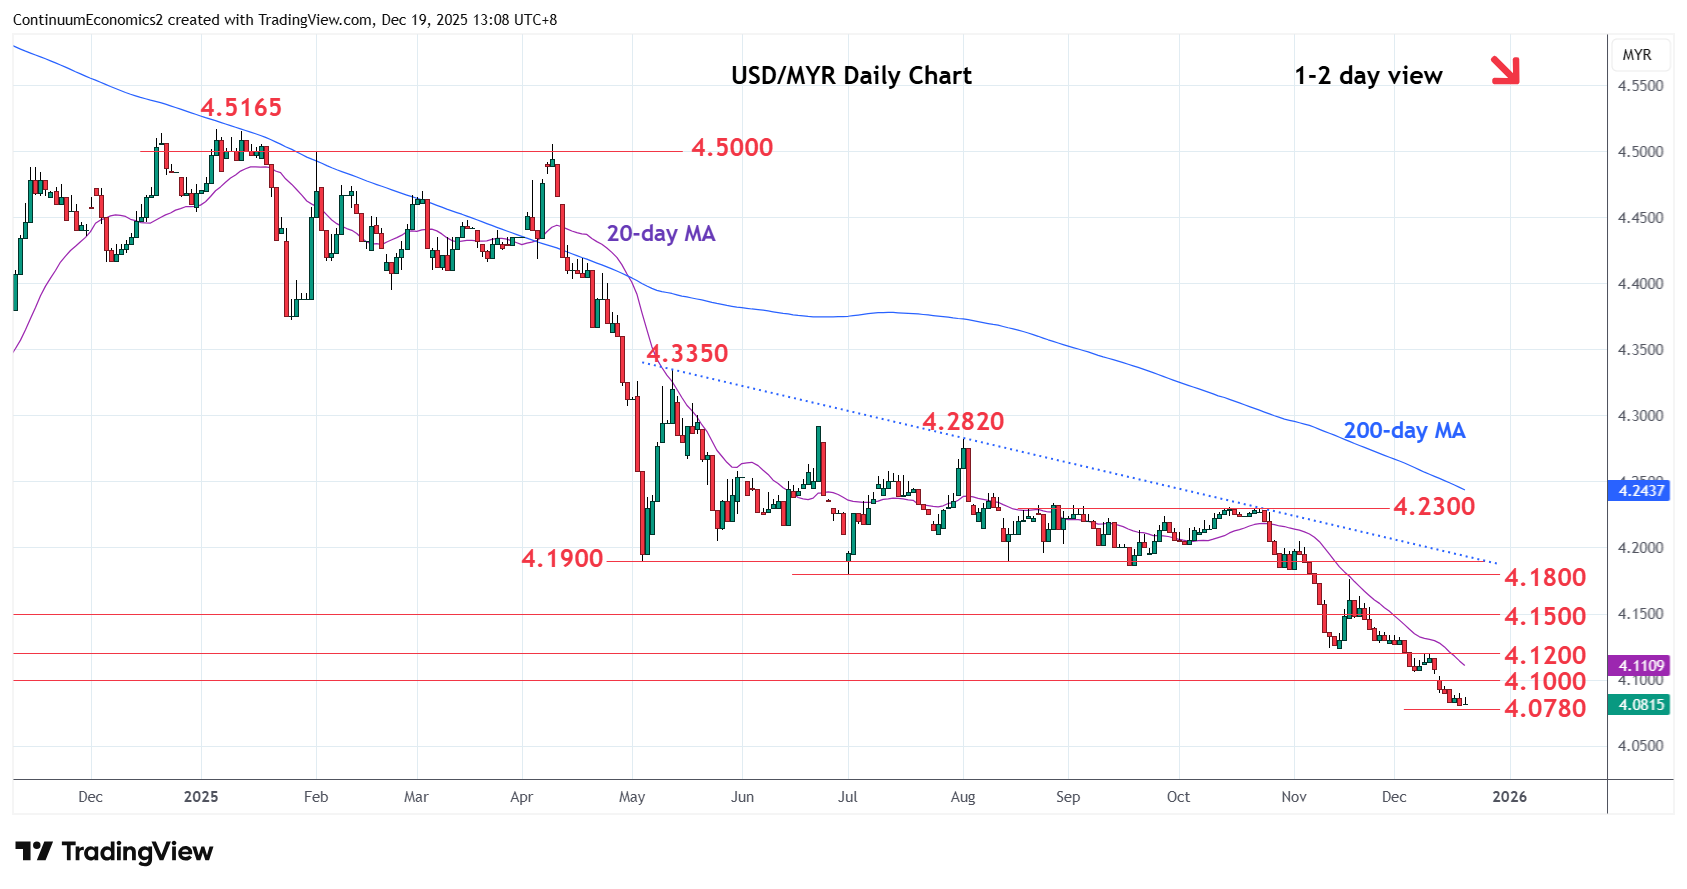
Still slipping as prices extend sharp losses from the 4.2300 October high to reach fresh year low at 4.0810
| Levels | Imp | Comment | Levels | Imp | Comment | |||
|---|---|---|---|---|---|---|---|---|
| R4 | 4.1800 | ** | Jul low | S1 | 4.0780 | * | 76.4% 2018/2024 rally | |
| R3 | 4.1470/00 | * | 18 Nov low, congestion | S2 | 4.0650 | Nov 2020 low | ||
| R2 | 4.1240 | ** | 14 Nov low | S3 | 4.0500 | * | congestion | |
| R1 | 4.1000/60 | * | congestion, 5 Dec low | S4 | 4.0280 | * | Feb 2021 low |
Asterisk denotes strength of level
05:20 GMT - Still slipping as prices extend sharp losses from the 4.2300 October high to reach fresh year low at 4.0810. Nearby see room to the 4.0780, 76.4% Fibonacci level, and the 4.0650/4.0500 congestion. Deep oversold daily and weekly studies see bearish momentum starting to slow and caution corrective bounce. Meanwhile, resistance is at the 4.1060 and 4.1240 recent lows. Would need lift over these to ease the downside pressure and open up room for corrective bounce to retrace losses from the 4.2300, October high.