Published: 2026-01-20T05:07:16.000Z
Chart USD/IDR Updates: Up to tag 16970, all-time high
-
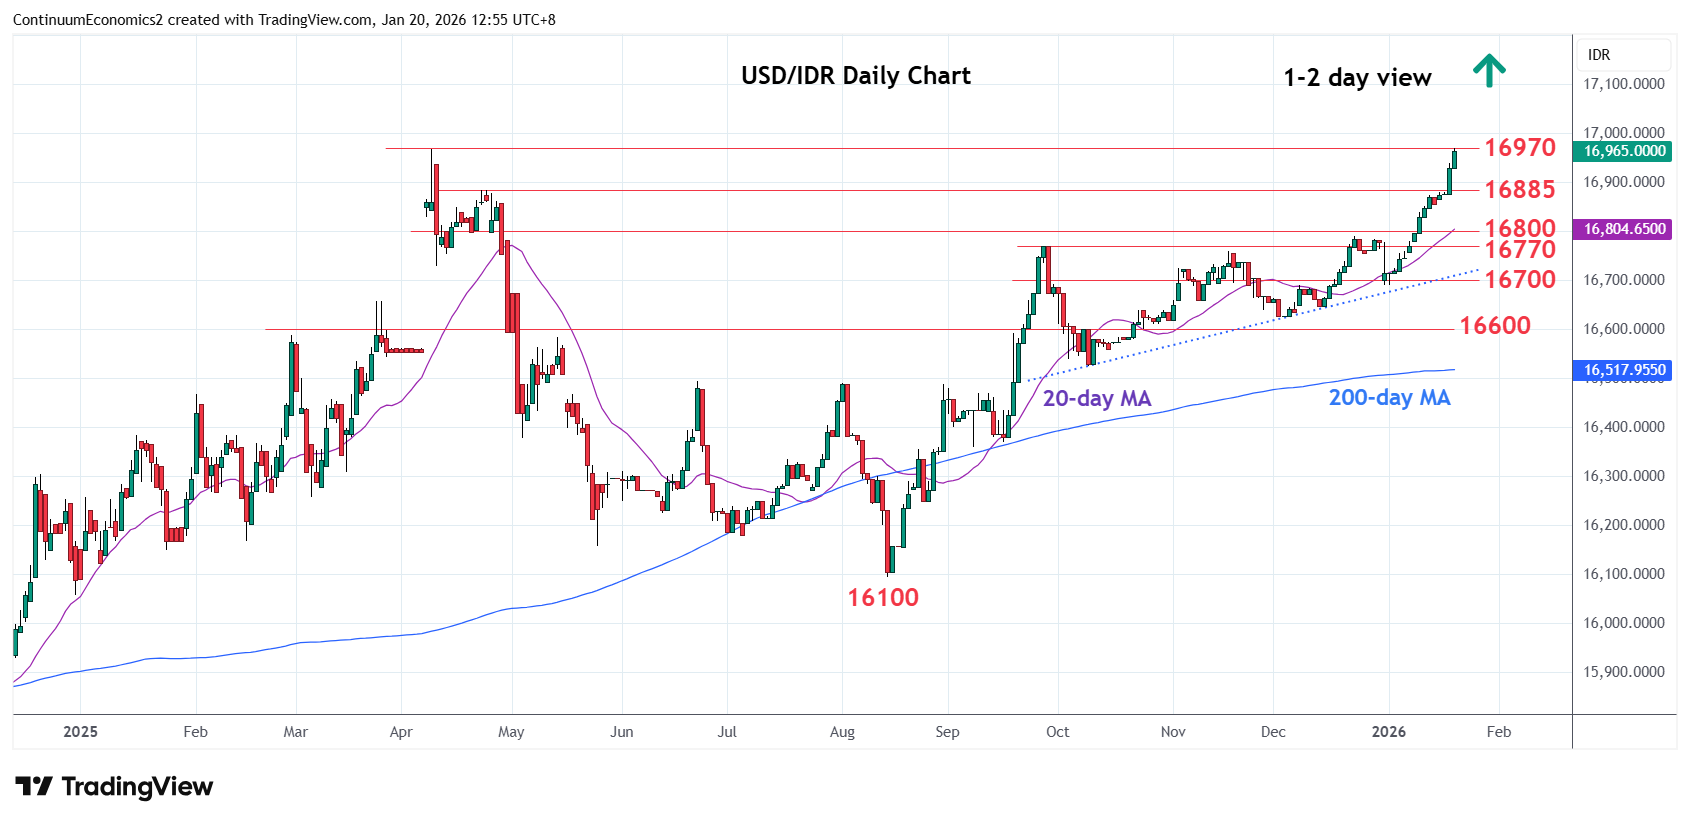
Pressure remains on the upside as prices extend gains from the 16100 August low to tag the 16970, 2025 all-time high
| Levels | Imp | Comment | Levels | Imp | Comment | |||
|---|---|---|---|---|---|---|---|---|
| R4 | 17500 | * | extension | S1 | 16900/885 | * | congestion, 23 Apr high | |
| R3 | 17270 | * | extension | S2 | 16800 | * | congestion | |
| R2 | 17050 | * | extension | S3 | 16770 | * | Sep high | |
| R1 | 16970 | ** | 9 Apr 2025 all-time high | S4 | 16690 | ** | 31 Dec low |
Asterisk denotes strength of level
05:00 GMT - Pressure remains on the upside as prices extend gains from the 16100 August low to tag the 16970, 2025 all-time high. Overbought daily and weekly studies suggest reaction here likely but a later break cannot be ruled out to extend the underlying bull trend. Meanwhile, support is raised to the 16900/16885 congestion and previous high which should underpin. Would take break here to ease the upside pressure and see room for deeper pullback to strong support at the 16800/16770 congestion area and September high.