Published: 2026-02-19T05:32:19.000Z
Chart USD/INR Update: Extending gains
2
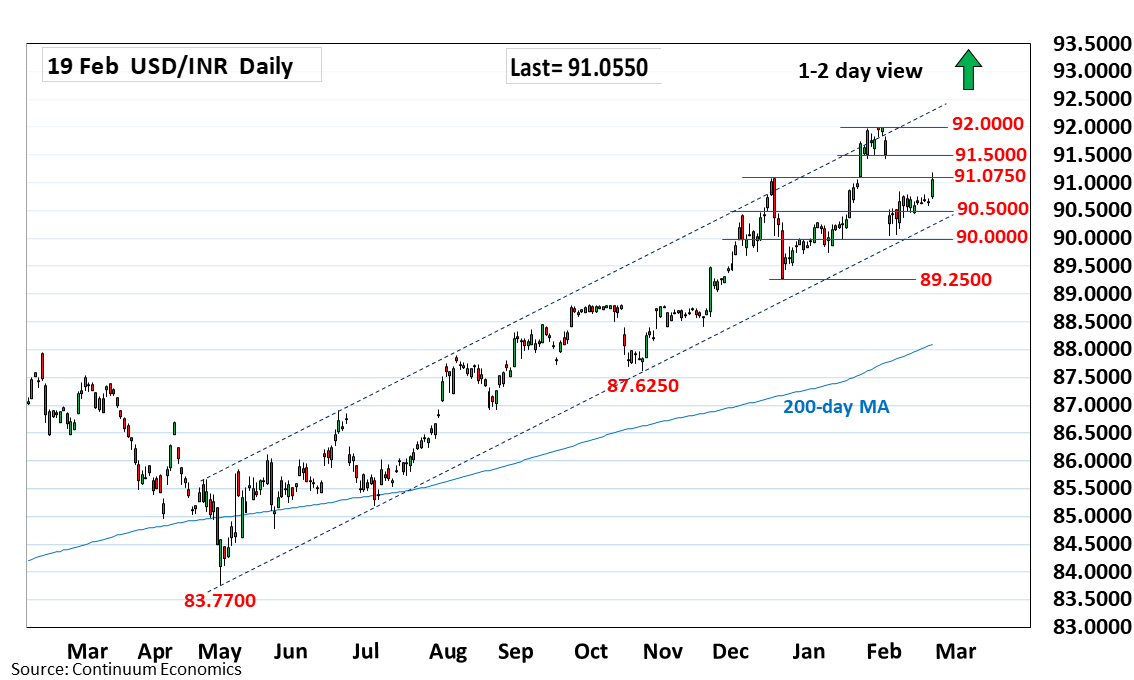
Consolidation below the 6 January high at 90.8400 has given way to break to extend bounce from the 90.0450, early February low
| Level | Comment | Level | Comment | |||||
|---|---|---|---|---|---|---|---|---|
| R4 | 92.1300 | * | extension | S1 | 90.5000 | * | congestion | |
| R3 | 91.9875 | ** | 30 Jan all-time high | S2 | 90.0000 | * | figure, congestion | |
| R2 | 91.5000 | * | congestion | S3 | 89.7400 | * | Jan low | |
| R1 | 91.0750 | ** | Dec high | S4 | 89.5000 | * | congestion |
Asterisk denotes strength of level
05:25 GMT - Consolidation below the 6 January high at 90.8400 has given way to break to extend bounce from the 90.0450, early February low. Gains to retest the 91.0750 December high has given way to consolidation but a later break here cannot be ruled out to resistance at the 91.5000 congestion. Gains are seen corrective and lower high sought to pressure the downside later. Meanwhile, support at the 90.8400/90.5000 area now underpin and see break here needed to return focus to the downside for retest support at 90.0450 low and 90.0000 figure.