Published: 2026-02-25T05:18:01.000Z
Chart USD/IDR Updates: Under pressure
2
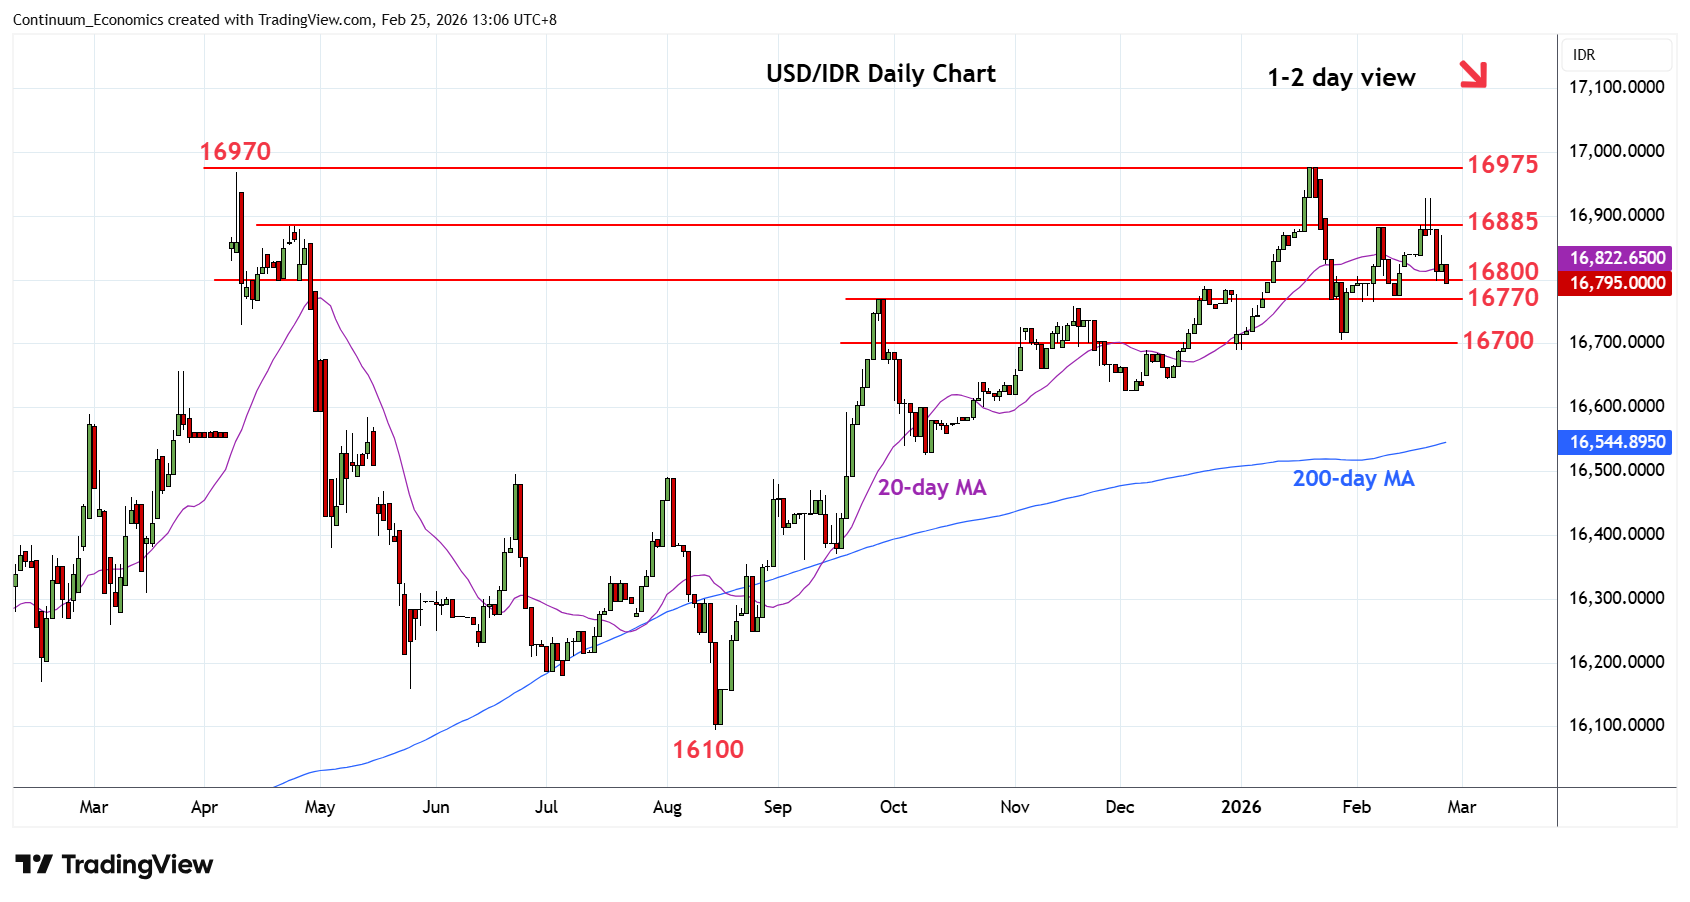
Break of the 16800 level see prices extending rejection from the 16930 high of last week
| Levels | Imp | Comment | Levels | Imp | Comment | |||
|---|---|---|---|---|---|---|---|---|
| R4 | 17050 | * | extension | S1 | 16770 | * | Sep high | |
| R3 | 16975 | ** | 20 Jan all-time high | S2 | 16705 | ** | 28 Jan YTD low | |
| R2 | 16930 | * | 19 Feb high | S3 | 16625 | * | Dec low | |
| R1 | 16885 | * | 6 Feb high | S4 | 16600 | * | congestion |
Asterisk denotes strength of level
05:10 GMT - Break of the 16800 level see prices extending rejection from the 16930 high of last week. Negative daily and weekly studies keep pressure on the downside and break of the 16770 support will see scope for retest of the 16705, January current year low. Below this will see room for deeper pullback to retrace the August/January rally to support at the 16625/16600 area. Meanwhile, resistance at the 16885 congestion is expected to cap corrective bounce. Only clearance will expose the 16930 and 16975 highs to retest.