Published: 2025-09-19T05:13:29.000Z
Chart USD/INR Update: Back to pressure 88.3300/88.4550 highs
1
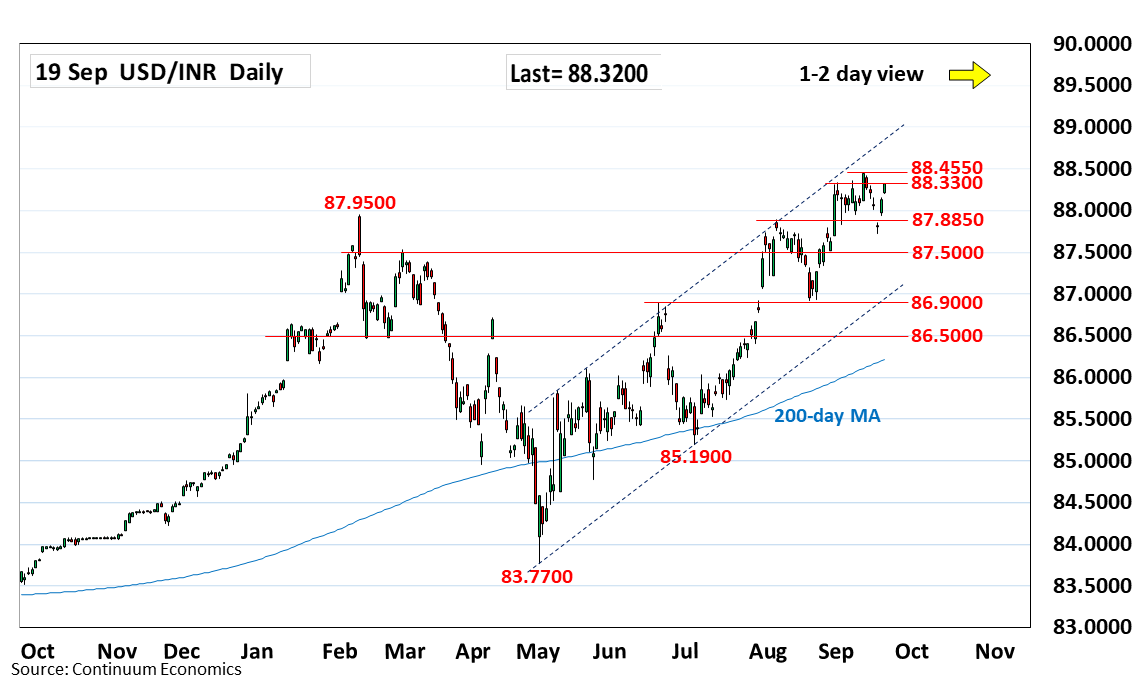
Sharply higher to extend bounce from the 87.7200 mid-week low to retest the 88.3300, 1 September high
| Level | Comment | Level | Comment | |||||
|---|---|---|---|---|---|---|---|---|
| R4 | 88.7000 | * | projection | S1 | 88.0000 | * | congestion | |
| R3 | 88.5000 | * | figure | S2 | 87.8850 | ** | 5 Aug high | |
| R2 | 88.4550 | ** | 11 Sep all-time high | S3 | 87.7200 | * | 17 Sep low | |
| R1 | 88.3300 | * | 1 Sep high | S4 | 87.5000 | * | figure |
Asterisk denotes strength of level
05:00 GMT - Sharply higher to extend bounce from the 87.7200 mid-week low to retest the 88.3300, 1 September high. Break here will expose the 88.4550 all-time high to retest. Would expect reaction here and give way to renewed selling pressure later. Clearance, if seen, will further extend gains within the bullish channel from the May low towards 88.5000 figure then 88.7000 projection. Meanwhile, support is raised to the 88.0000 level which extend to the 87.8850, 5 August high. Break of this area and the 87.7200 low will return focus to the downside.