Published: 2025-10-02T07:45:14.000Z
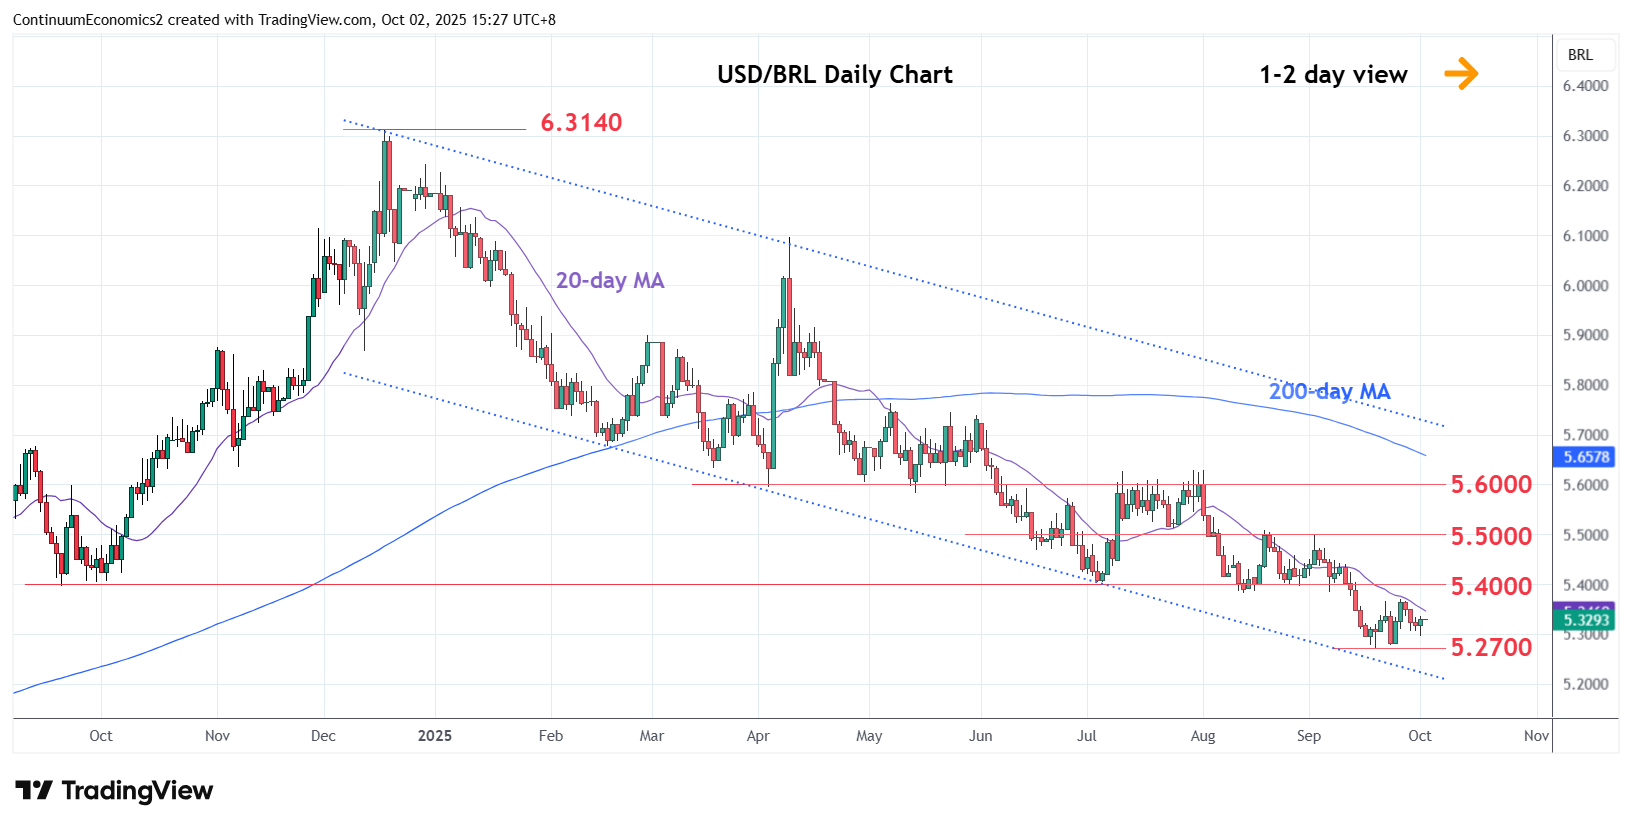
Chart USD/BRL Update: Consolidating above 5.2700 low
1
Turned up from the 5.2700 September current year as prices consolidate losses from the April high
| Levels | Imp | Comment | Levels | Imp | Comment | |||
|---|---|---|---|---|---|---|---|---|
| R4 | 5.5000 | ** | 2 Sep high, congestion | S1 | 5.3000 | * | congestion | |
| R3 | 5.4500 | * | congestion | S2 | 5.2700 | ** | 18 Sep YTD low | |
| R2 | 5.4000 | ** | congestion | S3 | 5.2420 | * | 6 Jun 2024 low | |
| R1 | 5.3700 | * | 25 Sep high | S4 | 5.2000 | * | congestion |
Asterisk denotes strength of level
07:40 GMT - Turned up from the 5.2700 September current year as prices consolidate losses from the April high. However, shallow bounce keep pressure firmly on the downside and further losses within the bear channel from the December high. Break, if seen, will see room to support at 5.2420 then the strong support at the 5.2000 congestion. Meanwhile, resistance is lowered to the 5.3700 high of last week and extending to the 5.4000 congestion. Would take break of this area to ease the downside to open up room for stronger corrective bounce to 5.4500/5.5000 congestion area.