Published: 2026-01-02T02:45:31.000Z
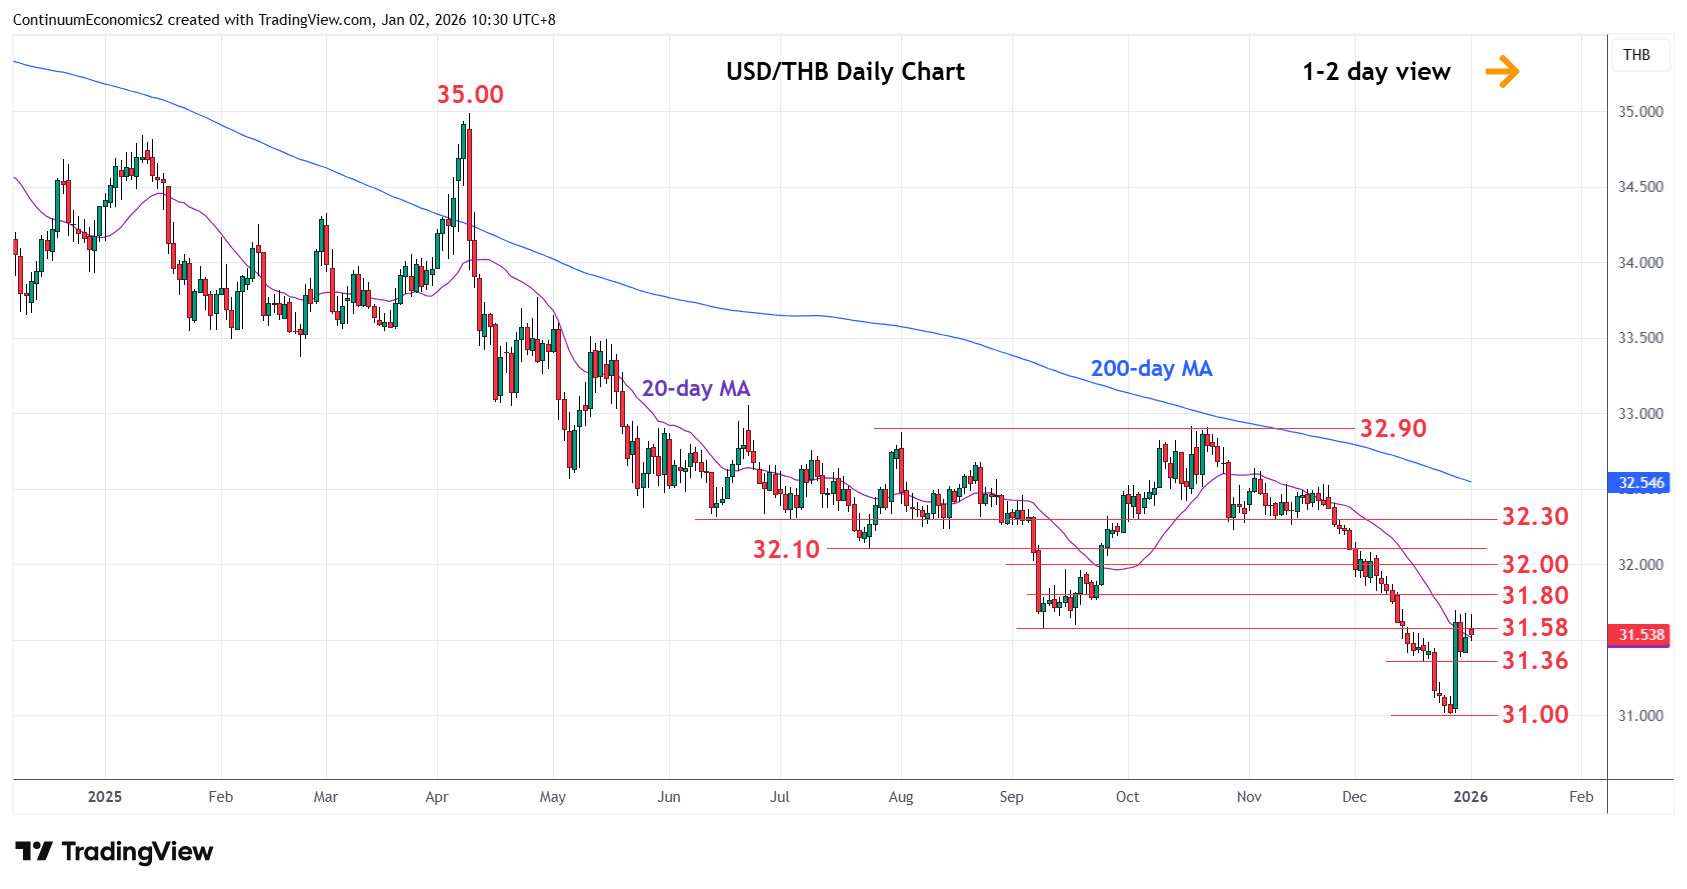
Chart USD/THB Update: Consolidating below 31.70 bounce high
-
Settled back from 31.70 late-December high as prices consolidate sharp bounce from the 31.00, 2025 year low
| Level | Comment | Level | Comment | |||||
|---|---|---|---|---|---|---|---|---|
| R4 | 32.10/14 | ** | Jul 2025, Sep 2024 lows | S1 | 31.36 | * | 18 Dec low | |
| R3 | 32.00 | * | figure | S2 | 31.00 | ** | 26 Dec 2025 year low | |
| R2 | 31.80 | * | congestion | S3 | 30.80 | * | Jun 2020 low | |
| R1 | 31.70 | ** | 29 Dec high | S4 | 30.60 | * | congestion |
Asterisk denotes strength of level
02:35 GMT - Settled back from 31.70 late-December high as prices consolidate sharp bounce from the 31.00, 2025 year low. This is seen correcting sharp losses from the 32.90 October high which is expected to give way to renewed selling pressure later. Break of the 31.00 low will see room for further losses to the 30.80/30.60 congestion area. Meanwhile, resistance at 31.70 is expected to cap. Break here, if seen, will open up room for stronger correction of the losses from 35.00/35.17, April 2025/November 2024 highs.