Published: 2026-04-02T05:38:38.000Z
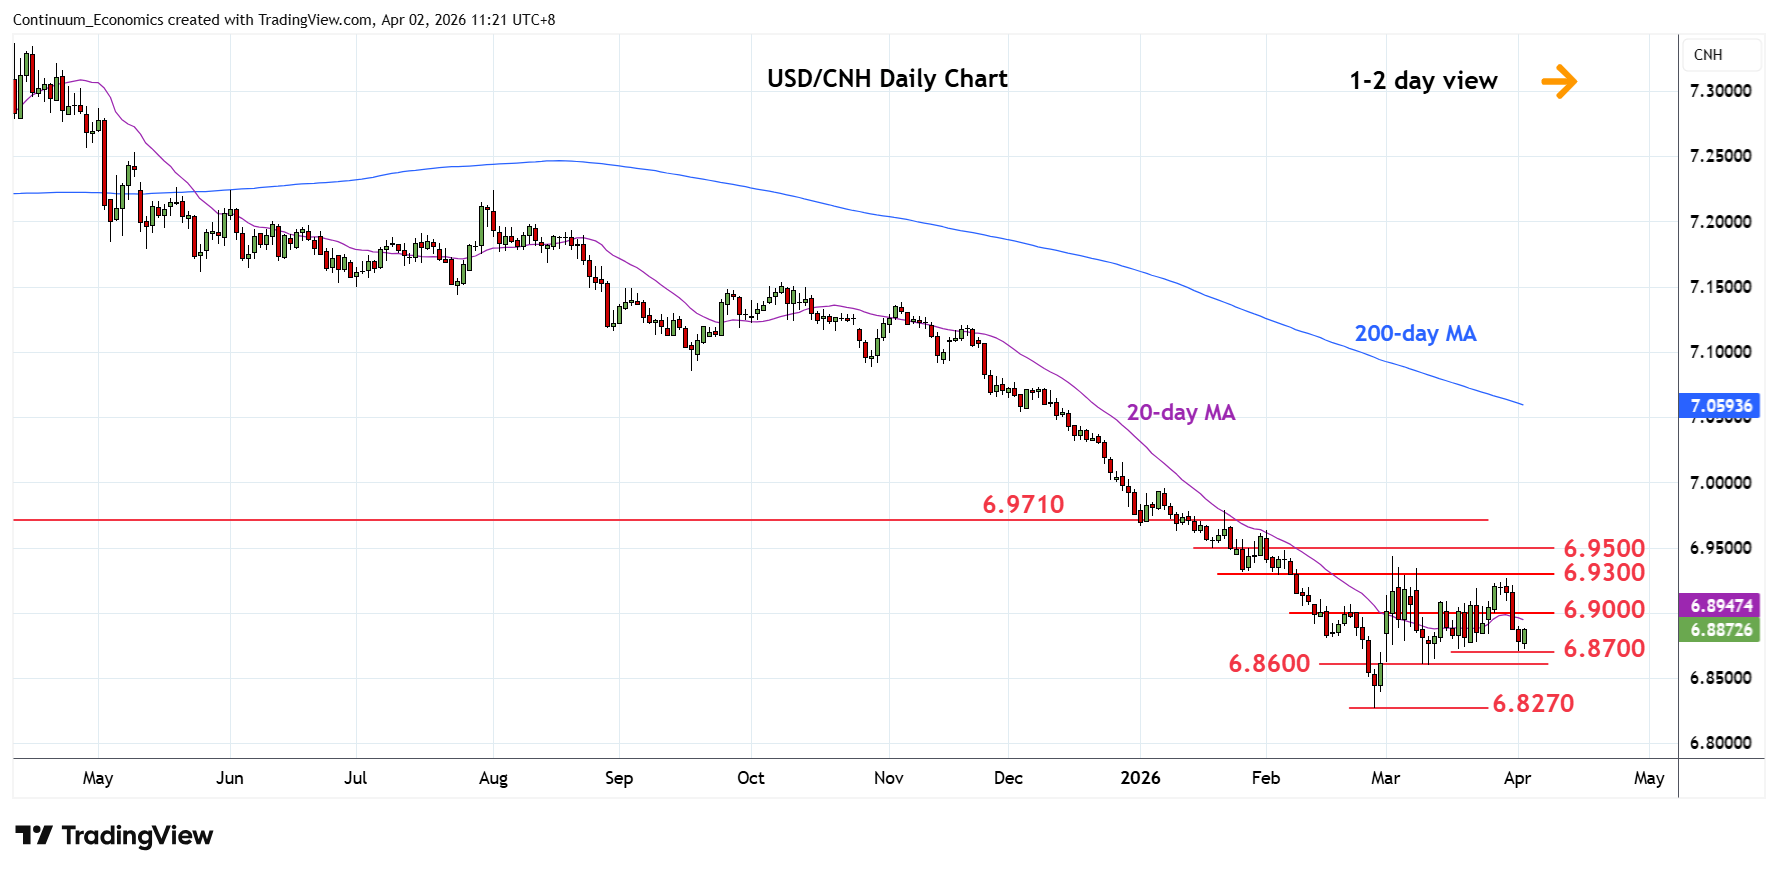
Chart USD/CNH Update: Lower within the March range
-
Rejection from the 6.9270 Monday's high has seen losses checked at the 6.8700/6.8600 support
| Level | Imp | Comment | Level | Imp | Comment | |||
|---|---|---|---|---|---|---|---|---|
| R4 | 6.9710 | * | 2024 year low | S1 | 6.8700 | * | 1 Apr low | |
| R3 | 6.9500 | * | 38.2% 2025/Feb fall | S2 | 6.8600 | ** | Mar low | |
| R2 | 6.9300 | ** | Jan low, congestion | S3 | 6.8270 | ** | 26 Feb YTD low | |
| R1 | 6.9000 | * | congestion | S4 | 6.8100 | * | Mar 2023 low |
Asterisk denotes strength of level
05:30 GMT - Rejection from the 6.9270 Monday's high has seen losses checked at the 6.8700/6.8600 support. However, negative daily studies see risk for break here to expose the 6.8270 February YTD low to retest. Break here will see further losses to retrace the 2022/2025 rally. Meanwhile, resistance is lowered to the 6.9000 congestion which is expected to cap. Only above here will open up room for further choppy gains to retest the 6.9270 Monday's high. Beyond this will see room to retest strong resistance at the 6.9300/6.9500 congestion and 38.2% Fibonacci level.