Published: 2025-10-30T04:57:28.000Z
Chart USD/INR Update: Pressure remains on the upside
1
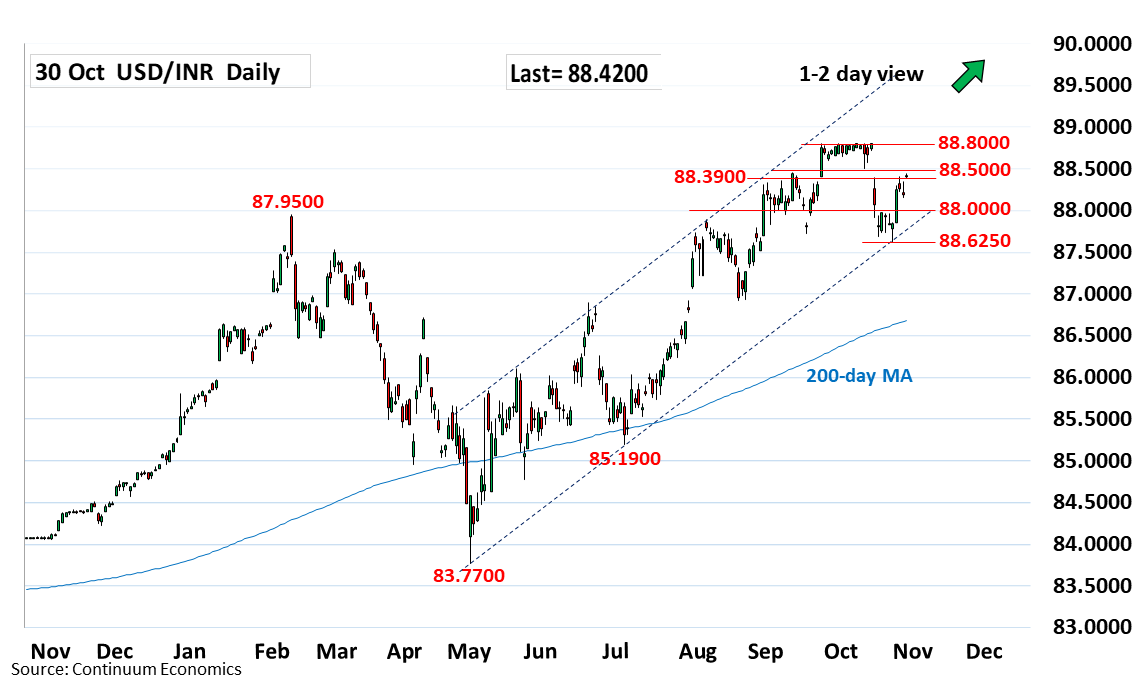
Pressure remains on the upside and break above 88.3900 resistance see room to target the 88.5000
| Level | Comment | Level | Comment | |||||
|---|---|---|---|---|---|---|---|---|
| R4 | 89.0000 | * | figure | S1 | 88.0000 | * | congestion | |
| R3 | 88.8000 | ** | 30 Sep all-time high | S2 | 87.8500 | * | 5 Aug high | |
| R2 | 88.6500 | * | 1 Oct low | S3 | 87.6250 | ** | 24 Oct low | |
| R1 | 88.5000 | ** | 10 Oct low | S4 | 87.4200 | * | 38.2% Jul/Sep rally |
Asterisk denotes strength of level
05:00 GMT - Pressure remains on the upside and break above 88.3900 resistance see room to target the 88.5000, 14 October low. Break here will return focus to the upside and see room to the 88.6500 resistance then the 88.8000, September all-time high. However, the latter expected to cap and lower high sought to further pressure the downside later. Meanwhile, support is at the 88.2200 mid-week low and this extend to the 88.0000 level which now underpin. Would take break of these to turn focus to the downside for retest of the 87.8500 support then the 87.6250 low and channel support.