Published: 2026-01-02T05:21:55.000Z
Chart USD/INR Update: Corrective bounce expected to give way to selling pressure
-
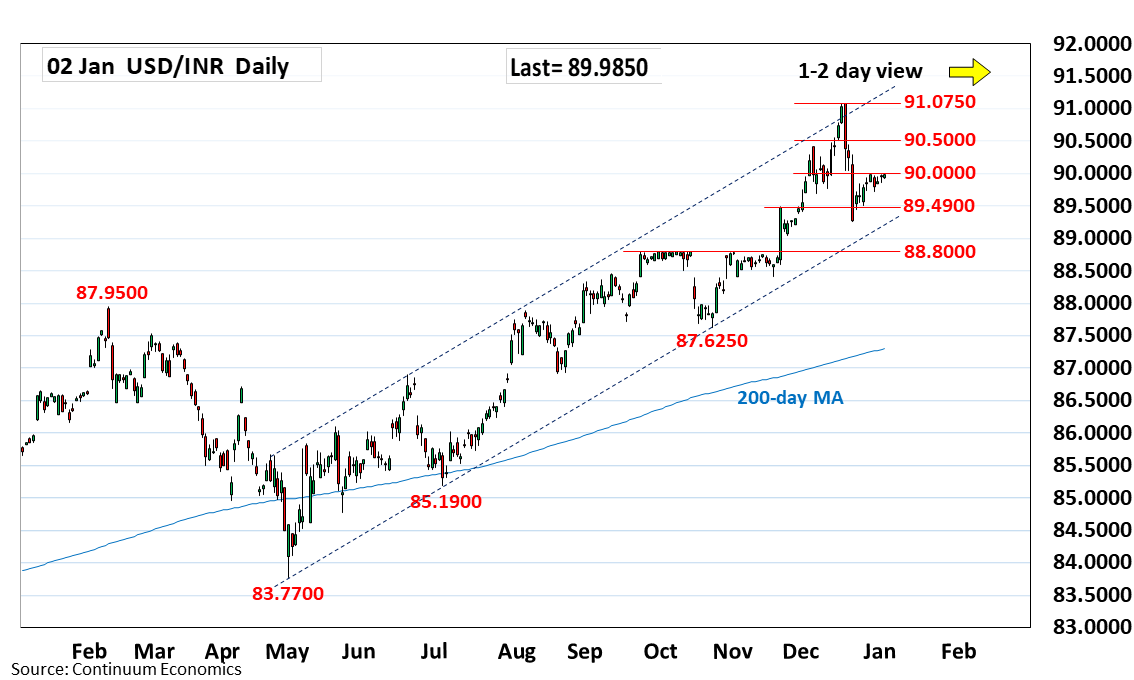
Extend bounce from the 89.2500 December low as prices retrace sharp losses from the 91.0750 record high
| Level | Comment | Level | Comment | |||||
|---|---|---|---|---|---|---|---|---|
| R4 | 91.0750 | ** | 16 Dec all-time high | S1 | 89.4900 | * | 21 Nov high | |
| R3 | 90.5000 | * | congestion | S2 | 89.2500 | ** | 19 Dec low | |
| R2 | 90.4200 | ** | 4 Dec high | S3 | 89.0000 | * | figure | |
| R1 | 90.0000 | * | figure | S4 | 88.8000 | ** | Sep high |
Asterisk denotes strength of level
05:15 GMT - Extend bounce from the 89.2500 December low as prices retrace sharp losses from the 91.0750 record high. Gains see prices unwinding oversold intraday and daily studies to approach the 90.0000 figure. This is expected to expected to cap and sustain sharp losses from the 91.0750 record high. Corrective gains are expected to give way to renewed selling pressure later to retest support at 89.4900 then 89.2500 low. Below these will see room for extension to the 89.0000 level then the strong support at 88.8000, September high.