Published: 2026-03-04T06:53:31.000Z
Chart USD/MYR Update: Extending gains
1
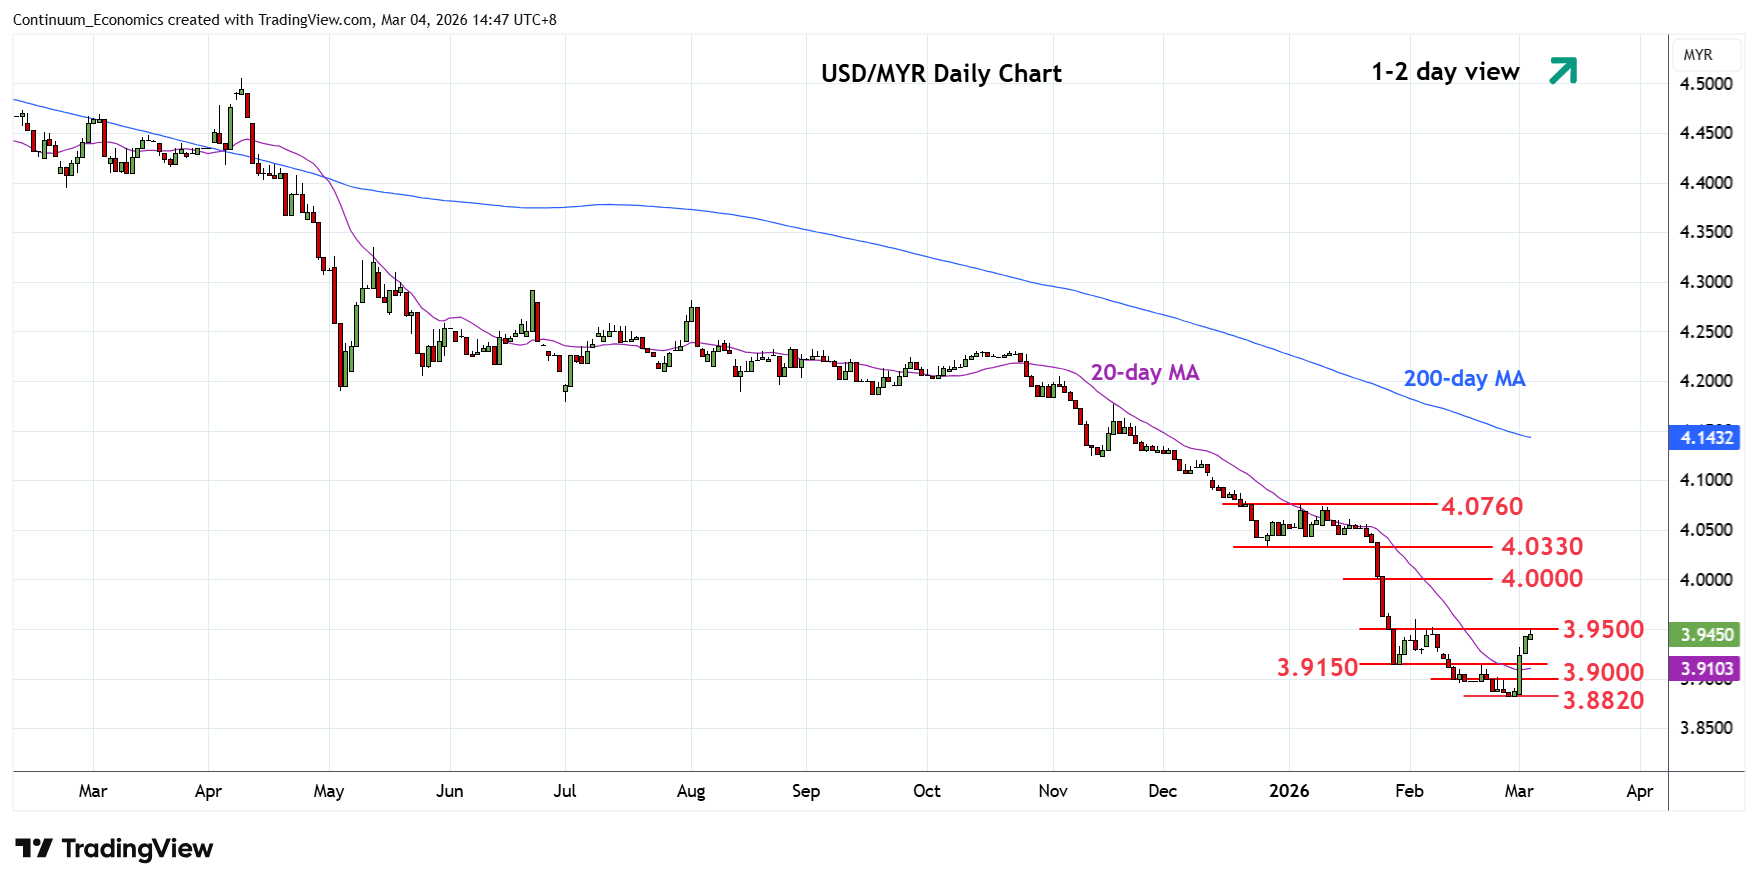
Extending break above the 3.9150 resistance to reach the resistance at the 3.9500 congestion
| Levels | Imp | Comment | Levels | Imp | Comment | |||
|---|---|---|---|---|---|---|---|---|
| R4 | 4.0500 | * | congestion | S1 | 3.9150 | * | Jan low | |
| R3 | 4.0330 | * | Dec low | S2 | 3.8820 | ** | 26 Feb YTD low | |
| R2 | 4.0000 | ** | figure, 2021 year low | S3 | 3.8700 | * | Jan 2018 low | |
| R1 | 3.9500 | * | congestion | S4 | 3.8560 | ** | Apr 2018 year low |
Asterisk denotes strength of level
06:50 GMT - Extending break above the 3.9150 resistance to reach the resistance at the 3.9500 congestion. Daily and week chart are unwinding oversold readings and suggest scope for stronger gains in the coming sessions to retrace losses from the 4.5165, January 2025 year high. Higher will see room to the strong resistance at 4.0000, figure and the 2021 year low. Meanwhile, support is raised to 3.9150 January low and congestion area which should now underpin and sustain bounce from the 3.8820, 26 February current year low.