Published: 2025-11-06T06:29:43.000Z
Chart USD/MYR Update: Under pressure
1
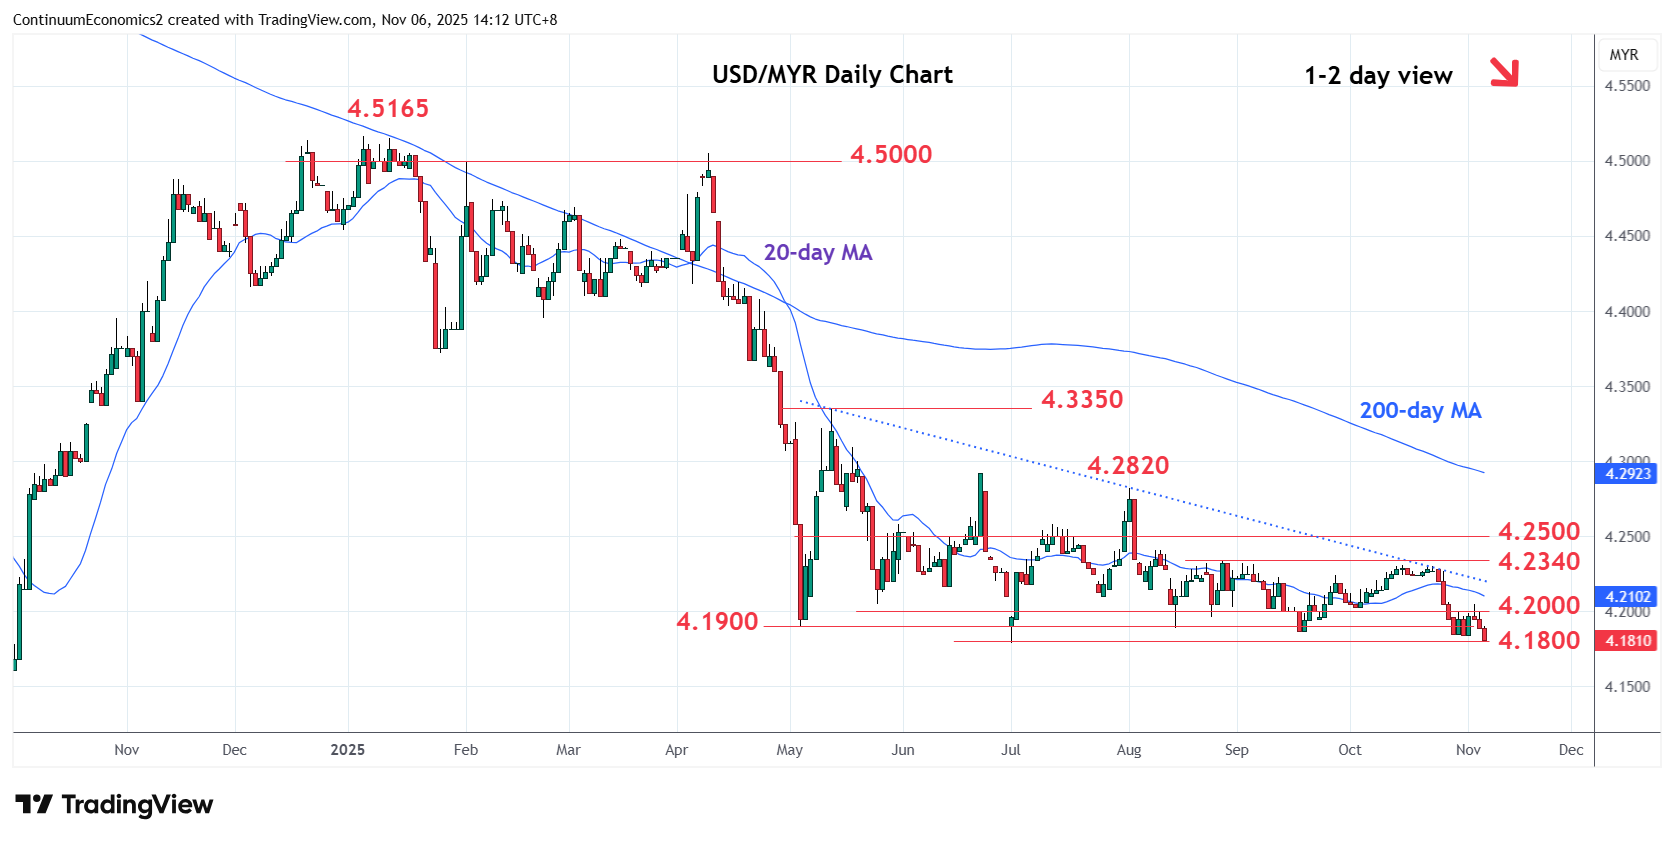
Consolidation at the 4.2000 level has given way to fresh selling pressure to retest the 4.1900 and 4.1800, May and 1 July current year lows
| Levels | Imp | Comment | Levels | Imp | Comment | |||
|---|---|---|---|---|---|---|---|---|
| R4 | 4.2400 | * | 8 Aug high | S1 | 4.1800 | ** | 1 Jul YTD low | |
| R3 | 4.2300/40 | ** | congestion, 27 Aug high | S2 | 4.1500 | * | congestion | |
| R2 | 4.2230 | * | 21 Oct low | S3 | 4.1150 | * | 25 Sep 2024 low | |
| R1 | 4.2000 | * | congestion | S4 | 4.1000 | ** | Sep 2024 year low |
Asterisk denotes strength of level
06:25 GMT - Consolidation at the 4.2000 level has given way to fresh selling pressure to retest the 4.1900 and 4.1800, May and 1 July current year lows. Negative daily and weekly studies suggest scope for break here to extend losses from the 4.5165 January high. Lower will see room to 4.1500 congestion. Below this will turn focus to the 4.1000 September 2024 year low. Meanwhile, resistance at the 4.2000 congestion which is expected to cap and sustain losses from the 4.2300/40 congestion and 27 August high.