Published: 2026-04-28T05:10:42.000Z
Chart USD/INR Update: Extending gains
1
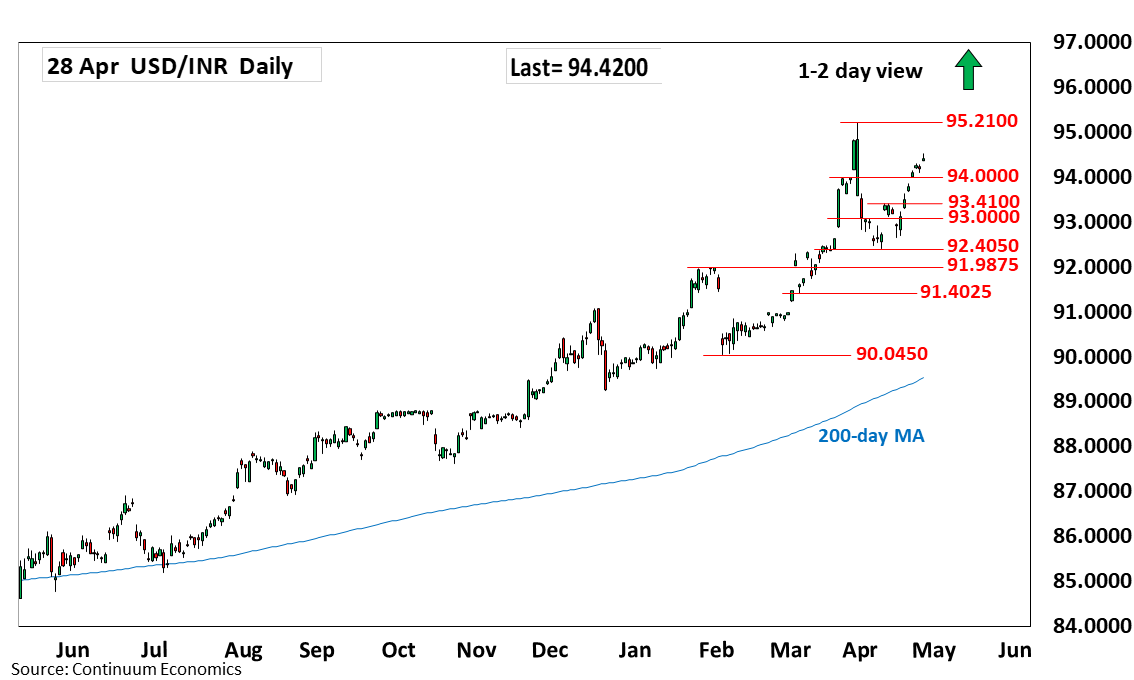
Break above the 94.0000 level see prices extending gains from the 10 April low at 92.4050 to reach 94.5225 high
| Level | Comment | Level | Comment | |||||
|---|---|---|---|---|---|---|---|---|
| R4 | 95.5000 | * | figure | S1 | 94.0000 | * | figure, congestion | |
| R3 | 95.2100 | ** | 30 Mar all-time high | S2 | 93.4100 | ** | 15 Apr high | |
| R2 | 94.8400 | * | 27 Mar high | S3 | 93.0000 | * | congestion | |
| R1 | 94.5225 | intraday high | S4 | 92.6550 | ** | 17 Apr low |
Asterisk denotes strength of level
05:10 GMT - Break above the 94.0000 level see prices extending gains from the 10 April low at 92.4050 to reach 94.5225 intraday high. Higher, will see scope to retest the 94.8400 high of 27 March then the 95.2100, 30 March all-time high. Meanwhile, support remains at the 94.0000 level. Would take break here to ease the upside pressure and see room for deeper pullback to strong support at the 93.4100, 15 April high. Below this will expose the 92.6500 and 92.4050 April lows to retest and see room for deeper pullback to retrace gains from the 90.0450 February low.