Published: 2026-03-03T07:01:20.000Z
Chart USD/TWD Update: Higher within January range
1
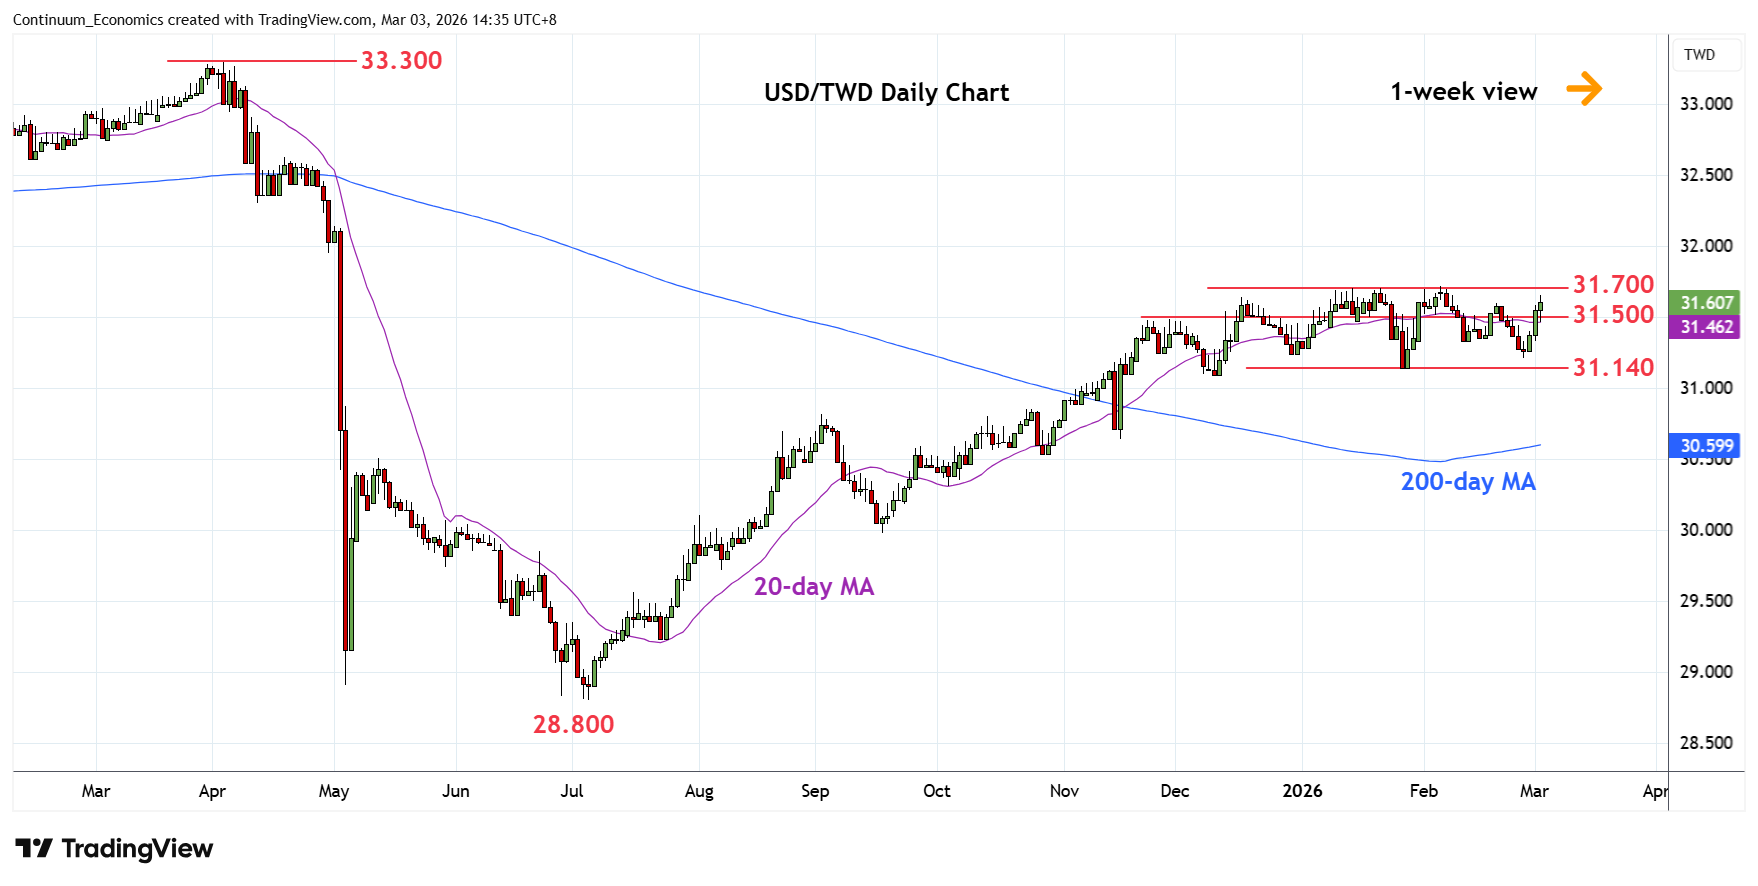
Higher within the 31.700/31.140 January range as prices turned up to unwind oversold daily studies
| Levels | Imp | Comment | Levels | Imp | Comment | |||
|---|---|---|---|---|---|---|---|---|
| R4 | 32.230 | * | 76.4% Apr/Jul fall | S1 | 31.500 | * | Nov high, congestion | |
| R3 | 32.000 | ** | figure, congestion | S2 | 31.200 | * | Feb low | |
| R2 | 31.800 | * | congestion | S3 | 31.140 | ** | 27 Jan YTD low | |
| R1 | 31.700 | ** | January high | S4 | 31.000 | * | congestion |
06:50 GMT - Higher within the 31.700/31.140 January range as prices turned up to unwind oversold daily studies. Break above the 31.500 level clears the way for retest of the 31.700 high. Break here will further retrace the April/July 2025 losses and see room to 31.800 congestion. Higher still will see room to strong resistance at the 32.000 level. Meanwhile, support is raised to the 31.500 congestion which should underpin. Would take break here to open up room for pullback to strong support at the 31.200/31.140 lows.