Published: 2026-02-23T06:36:24.000Z
Chart USD/MYR Update: Extending losses
-
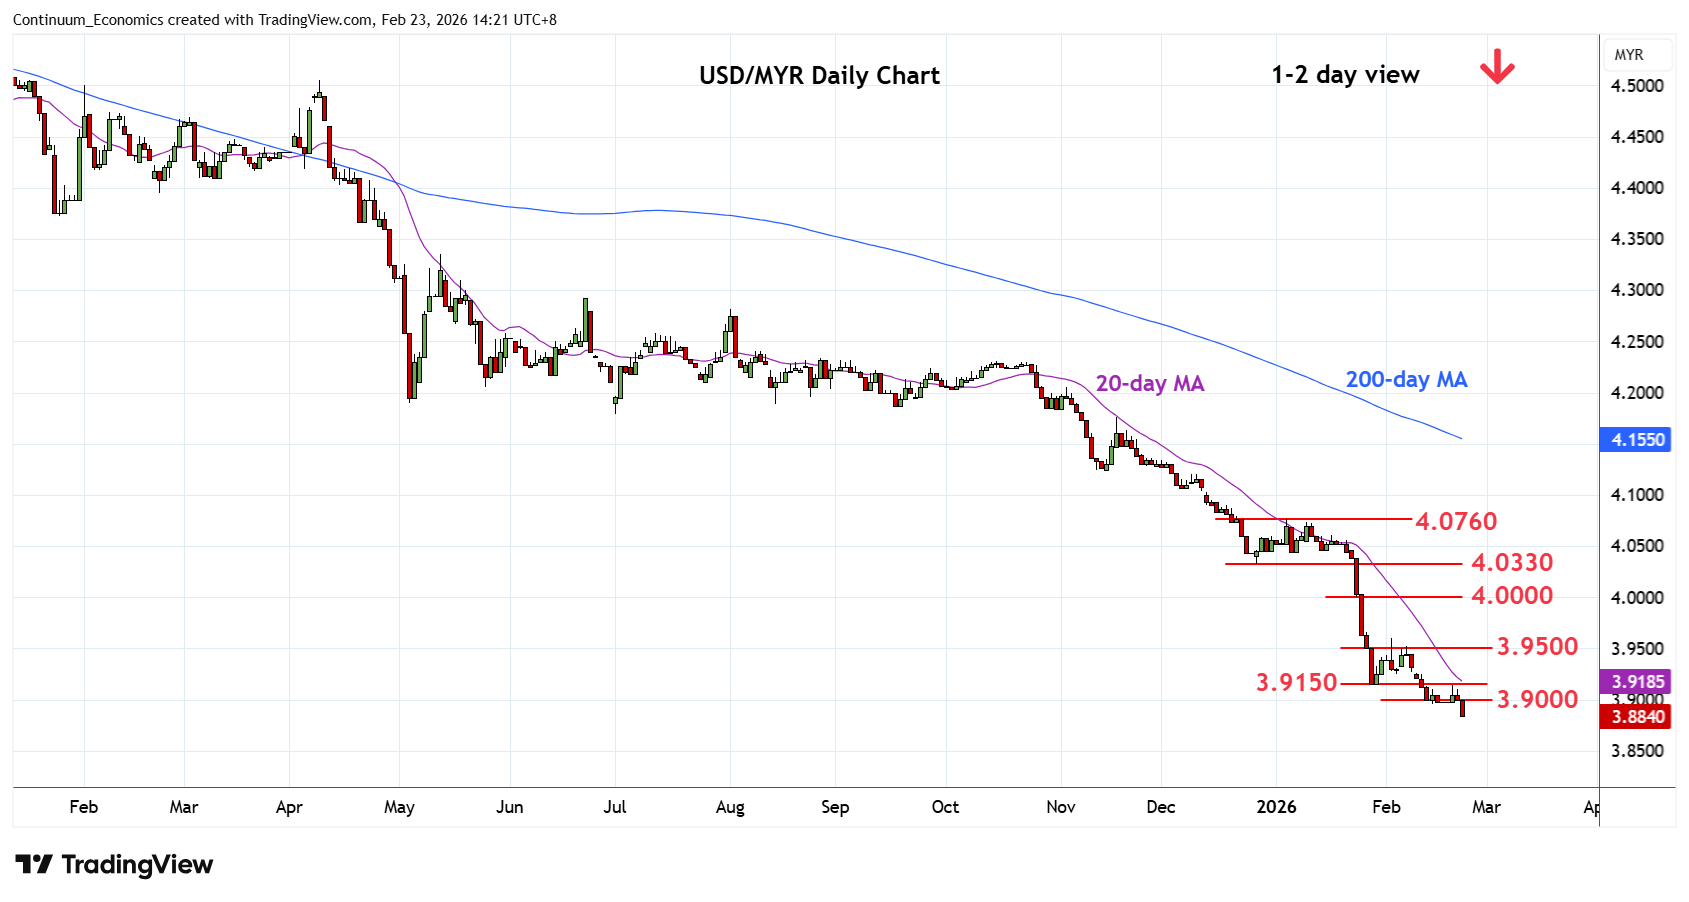
Consolidation around the 3.9000 level has given way break to reach fresh year low at 3.8850
| Levels | Imp | Comment | Levels | Imp | Comment | |||
|---|---|---|---|---|---|---|---|---|
| R4 | 4.0000 | ** | figure, 2021 year low | S1 | 3.8700 | * | Jan 2018 low | |
| R3 | 3.9500 | * | congestion | S2 | 3.8560 | ** | Apr 2018 year low | |
| R2 | 3.9150 | * | Jan low | S3 | 3.8380 | ** | Apr 2016 year low | |
| R1 | 3.9000 | * | congestion | S4 | 3.8200 | * | congestion |
Asterisk denotes strength of level
06:30 GMT - Consolidation around the 3.9000 level has given way break to extend losses from the 2024 year high to reach fresh year low at 3.8850. Bearish structure and negative daily and weekly studies keeps pressure firmly on the downside and lower will see room 3.8700, January 2018 low. Below this will turn focus to the April 2018 year low at 3.8560. Meanwhile, resistance at the 3.9000/3.9150 congestion and January low is expected to cap and sustain losses from the 4.0760, January current year high.